
⤴️-Paid Ad- Check advertising disclaimer here. Add your banner here.🔥
All Activity
- Past hour
-
 Freddie79 joined the community
 - Today
-

HFMarkets (hfm.com): Market analysis services.
AllForexnews replied to AllForexnews's topic in Fundamental Analysis
[B]Date: 15th September 2026.[/B] [B]NASDAQ Rebound Ends as US Bond Yields Break Above 5%.[/B] Technology stocks attempt a rebound after declining to a five-week low. However, fundamentals continue to weigh on demand as yields and oil prices rise. The US 10-year bond yield has now reached the highest level since 2007 and risen above the critical 5% mark. Oil prices also continue to remain above $100 and have reached a high of $103.45. In addition to volatility among technology stocks, the US Dollar also moves higher and is the best-performing currency. The worst-performing currencies are the Japanese Yen and New Zealand Dollar. Market indications continue to point towards investors pricing in more frequent rate hikes, lower consumer sentiment, and higher credit risk. A key indication that investors are paying close attention to is bond yields rising to levels that indirectly contributed to the 2007-2008 financial crisis. NASDAQ Rebound Fails as Investors Await AI Clarity The NASDAQ has fallen 0.30% this morning and 1% from the most recent high. Investors on Monday did take advantage of the lower purchase price, which boosted demand as a result. However, many elements continue to point towards the possibility of stock market weakness. A key development is in the AI sector which continues to see AI companies and the White House clash. Lawmakers are developing legislation to address AI safety concerns. This includes a bipartisan group of senators working on measures that would require leading AI developers to take steps to prevent catastrophic risks. White House advisor David Sacks advises that AI-companies are looking for the government to loosen legislation related to antitrust and reliability. According to experts, this is not likely to change, and for this reason, AI-companies will look to slow production to closely monitor risks. Traders should keep in mind that AI development has been one of the key drivers of the market’s bullish trend over the past three years. A key risk for investors is the possibility that this momentum weakens, removing an important source of support for the broader market. In addition to this, tomorrow’s Federal Reserve interest rate decision and the Chair’s tone are likely to create considerable volatility. Currently, investors are pricing in up to two interest rate hikes in 2026. If the Fed hikes tomorrow evening and takes a hawkish tone, demand for stocks could fall. HFM - NASDAQ 12-Minute Chart Currently, the price remains below key moving averages and below the VWAP. Order flow is also indicating weakness in demand. If the price falls below $29,004.38, sell signals from technical analysis are likely to strengthen. If the price rises above $29,215.65, sell signals in the short term will be completely erased. GBP/USD - US Dollar Rises While UK Employment Weakness Pressures the Pound The British Pound is coming under pressure from the most recent employment data. The UK’s monthly benefit claims have risen by almost 28,000, significantly higher than previous expectations. The figure is also a three-month high and is considerably weaker compared to the latest US NFP data. In addition to this, the market continues to expect the Bank of England to keep interest rates unchanged on Thursday, unlike the Federal Reserve and European Central Bank. The US Dollar Index rose 0.20% during this morning’s Asian session and is also close to forming a bullish breakout. Supporting the US Dollar is the increase in bond yields and rate-hike expectations. The fact that US 10-year bond yields have risen above 5% could trigger lower risk appetite. This could also support the US Dollar due to its safe haven-status. The price of the GBP/USD is forming clear bearish swings and lower highs. Technical indicators also point towards a bearish bias, but investors will be cautious of the support level at 1.34630. Bearish sentiment is likely to remain while the GBP/USD remains below the 200-bar moving average at 1.34915. HFM - GBPUSD 12-Minute Chart Key Takeaways: Technology stocks remain under pressure despite attempts to rebound from recent five-week lows. US 10-year bond yields above 5% are increasing concerns around borrowing costs and financial conditions. Oil prices above $100 are reinforcing inflation concerns and adding pressure on broader market sentiment. The US Dollar is strengthening as investors price in further rate hikes and rising risk aversion. [B]Always trade with strict risk management. Your capital is the single most important aspect of your trading business.[/B] [B]Please note that times displayed based on local time zone and are from time of writing this report.[/B] Click [URL='https://www.hfm.com/hf/en/trading-tools/economic-calendar.html'][B]HERE[/B][/URL] to access the full HFM Economic calendar. Want to learn to trade and analyse the markets? Join our webinars and get analysis and trading ideas combined with better understanding of how markets work. Click [URL='https://www.hfm.com/en/trading-tools/trading-webinars.html'][B]HERE[/B][/URL] to register for FREE! [URL='https://analysis.hfm.com/'][B]Click HERE to READ more Market news.[/B][/URL] [B]Michalis Efthymiou HFMarkets[/B] [B]Disclaimer:[/B] This material is provided as a general marketing communication for information purposes only and does not constitute an independent investment research. Nothing in this communication contains, or should be considered as containing, an investment advice or an investment recommendation or a solicitation for the purpose of buying or selling of any financial instrument. All information provided is gathered from reputable sources and any information containing an indication of past performance is not a guarantee or reliable indicator of future performance. Users acknowledge that any investment in Leveraged Products is characterized by a certain degree of uncertainty and that any investment of this nature involves a high level of risk for which the users are solely responsible and liable. We assume no liability for any loss arising from any investment made based on the information provided in this communication. This communication must not be reproduced or further distributed without our prior written permission. -

Market Technical Analysis by RoboForex
RBFX Support replied to RBFX Support's topic in Technical Analysis
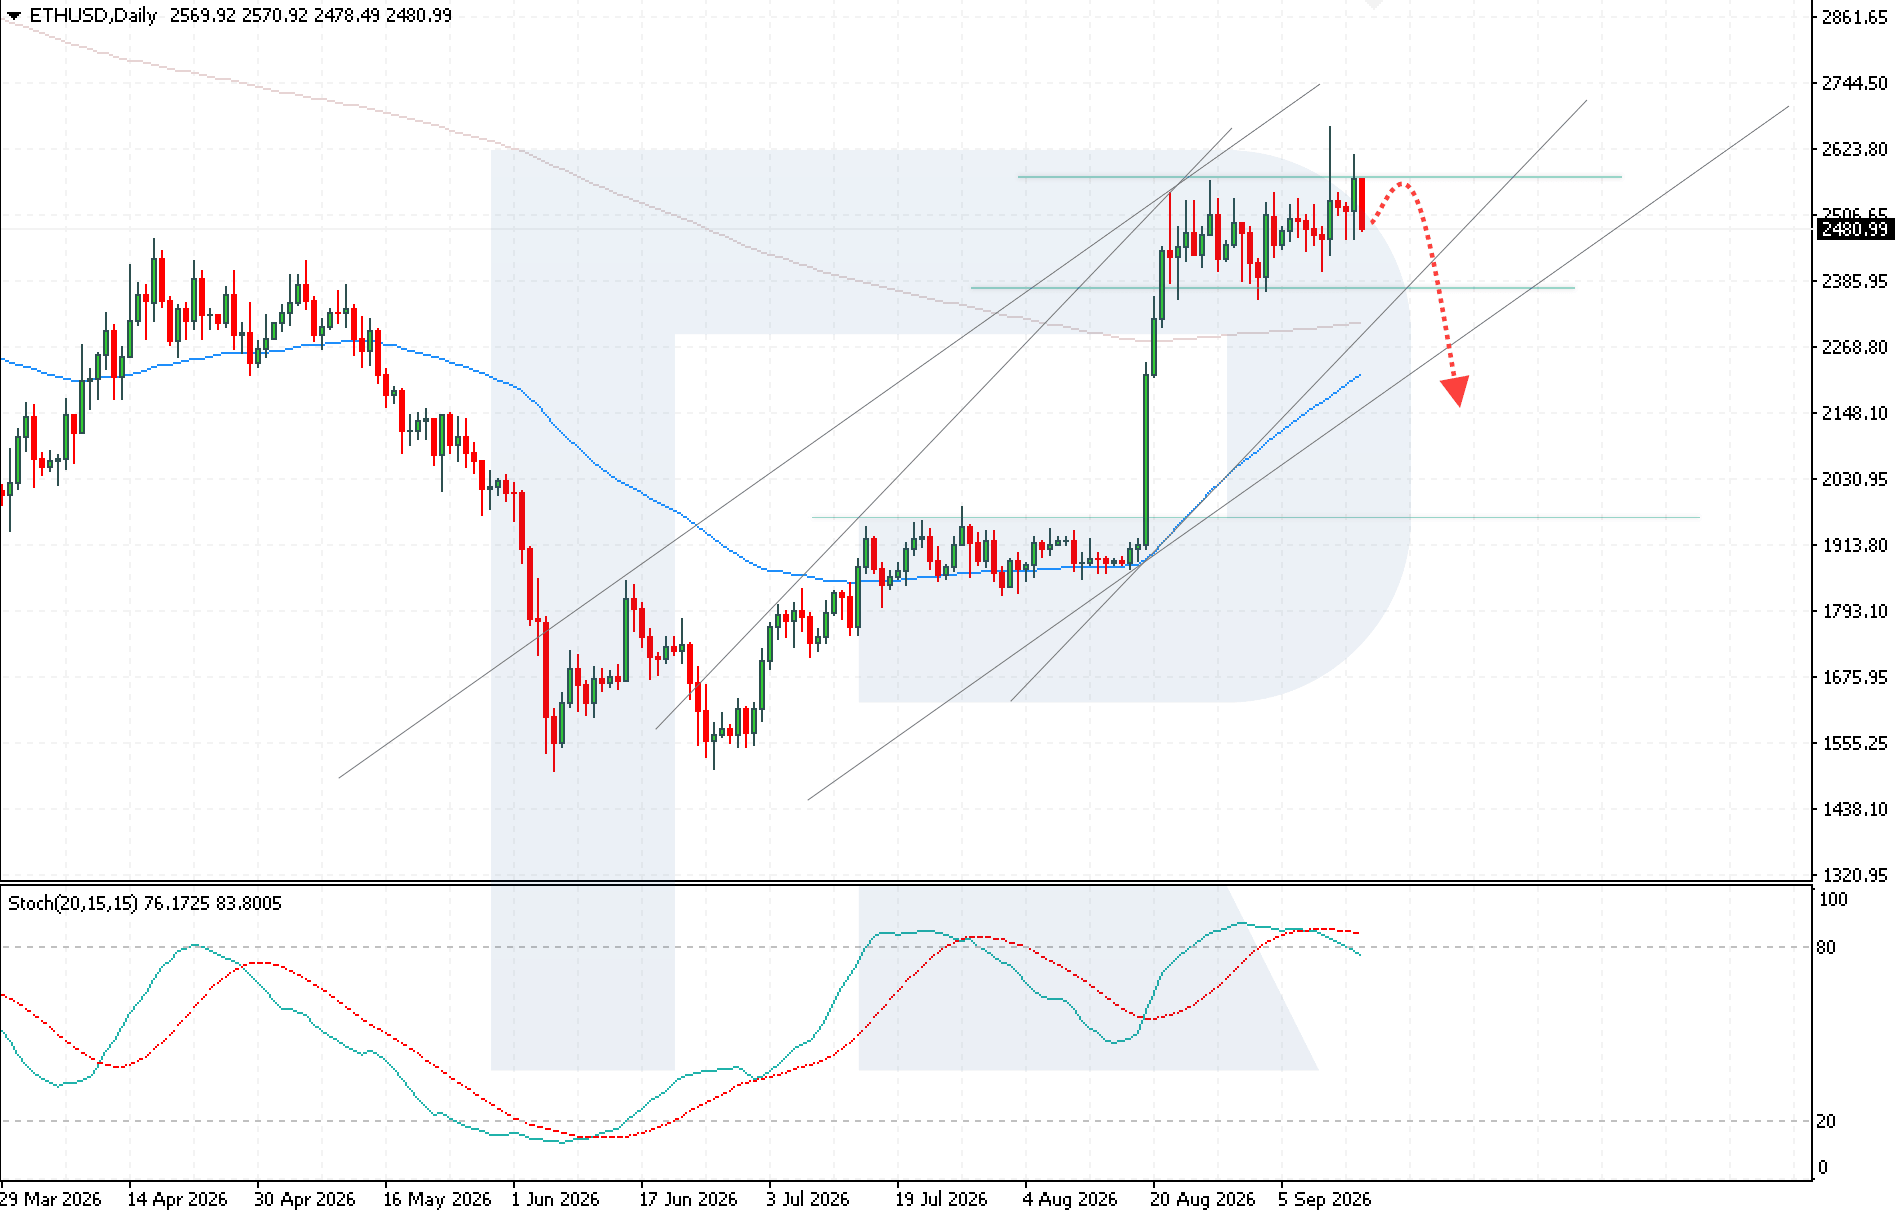
ETHUSD approaches key support level ETHUSD remains under pressure after another failed test of a strong resistance level, with the price currently trading at 2,480 USD. Technical outlook ETHUSD remains above the EMA-65, indicating that buyers still have upside potential. However, bulls' renewed attempts to break above the 2,520 USD resistance level are again encountering active selling pressure. The prolonged struggle by buyers against the 2,520 USD resistance level increases the risk of ETHUSD falling towards 2,365 USD. Read more - ETHUSD Forecast Attention! Forecasts presented in this section only reflect the author’s private opinion and should not be considered as guidance for trading. RoboForex bears no responsibility for trading results based on trading recommendations described in these analytical reviews. Sincerely, The RoboForex Team
-
roboforex Market Fundamental Analysis by RoboForex
RBFX Support replied to RBFX Support's topic in Fundamental Analysis
US 500: oil, bonds, and the Federal Reserve rate The US 500 index has stabilised following the US market decline earlier in the week, but pressure from the technology sector, high oil prices, and rising yields persists. US 500 forecast: key takeaways The semiconductor sector saw increased selling following new warnings about the risks of rapid artificial intelligence development The likelihood of a 25-basis-point Federal Reserve rate hike on Wednesday stands at 92%, while high oil prices and rising yields are adding further pressure on stocks US 500 forecast for 15 September 2026: 7,615 and 7,575 Fundamental analysis US stock index futures stabilised on Tuesday after the major indices declined at the start of the week. On Monday, the Nasdaq Composite lost 0.56%, the S&P 500 fell by 0.48%, and the Dow Jones declined by 0.29%. The technology sector came under the greatest pressure. Investor sentiment deteriorated after Anthropic CEO Dario Amodei called for a slowdown in the pace of artificial intelligence development due to risks associated with the continued expansion of model capabilities. RoboForex Market Analysis & Forex Forecasts Attention! Forecasts presented in this section only reflect the author’s private opinion and should not be considered as guidance for trading. RoboForex bears no responsibility for trading results based on trading recommendations described in these analytical reviews. Sincerely, The RoboForex Team -
 Weekly Review: XAUUSD, #SP500, #BRENT | September 18, 2026 XAUUSD: SELL 4335.00, SL 4370.00, TP 4255.00 No swaps on majors for a month! Learn more The main driver of the week for gold is the Fed meeting against the backdrop of accelerating inflation and a new surge in oil prices. The market assesses a high probability of an interest rate hike, while higher yields on US Treasury bonds reduce the attractiveness of the asset, which does not generate interest income. Geopolitical tensions maintain safe-haven demand for the metal and can restrain declines. However, as expectations for tighter Fed policy are strengthening faster than demand for safe-haven assets, the weekly fundamental scenario remains in favor of moderate pressure on XAUUSD. Trading Idea: SELL 4335.00, SL 4370.00, TP 4255.00 #SP500: SELL 7660, SL 7715, TP 7530 For #SP500, the main event of the week will be the Fed decision: accelerating inflation and expensive oil have strengthened expectations of an interest rate hike. Higher borrowing costs and Treasury bond yields near multi-year highs increase the sensitivity of stocks to tight signals from the regulator. A separate risk is associated with the technology sector: a new round of discussion about AI development rates has increased pressure on related companies in Asia. Strong earnings expectations limit the scale of the decline, but this week the fundamental background remains unfavorable for #SP500. Trading Idea: SELL 7660, SL 7715, TP 7530 #BRENT: BUY 104.05, SL 101.55, TP 109.05 Brent retains support from supply risks following attacks on Saudi Arabia's oil infrastructure and shipping complications in the region. A temporary halt to a key east-west pipeline intensifies concerns about the availability of export routes given limited movement through the Strait of Hormuz. Weakening global demand assessments remain a restraining factor, and strong oil growth last week already reduced some of the further potential. Nevertheless, the risk of new supply disruptions still maintains a fundamental advantage for the #BRENT growth scenario during the week. Trading Idea: BUY 104.05, SL 101.55, TP 109.05 Our company provides an opportunity to earn income not only from your trading. By attracting clients within the affiliate program, you can get up to $30 per lot! You can find more analytical information on our website.
 -
 ⭐ suresh.hacker reacted to a post in a topic:
The W.D. Gann Timing System
⭐ suresh.hacker reacted to a post in a topic:
The W.D. Gann Timing System
-
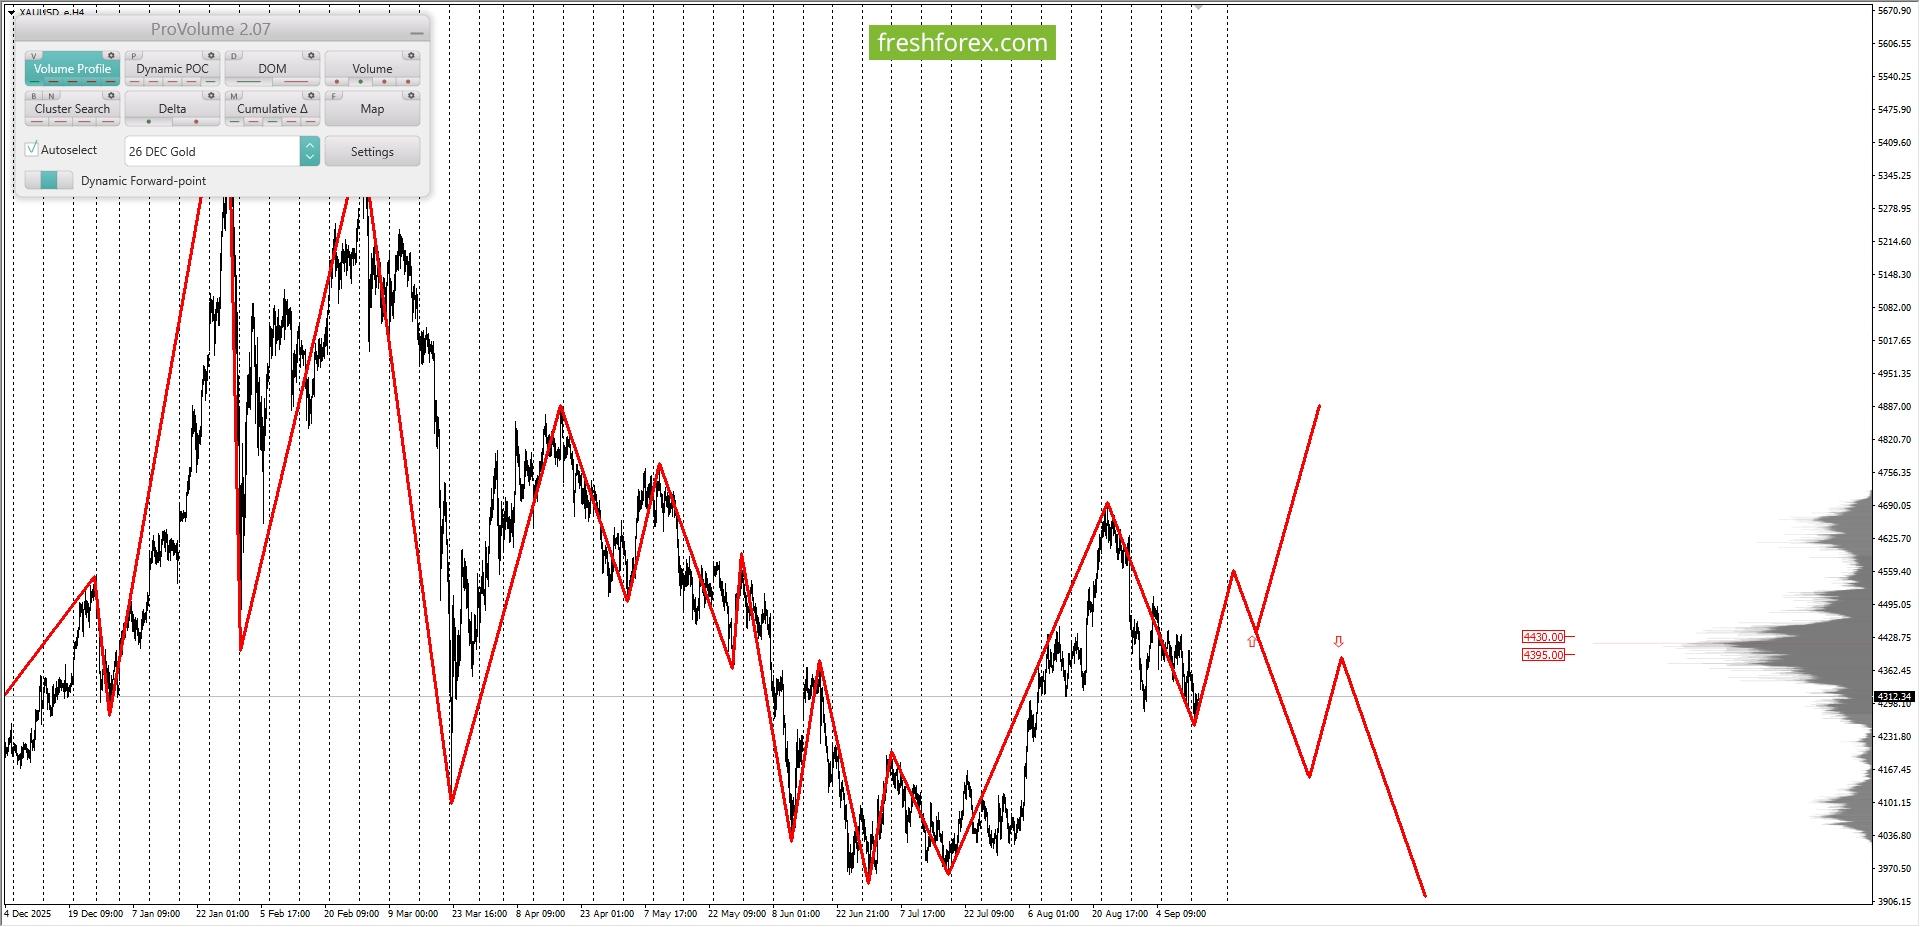
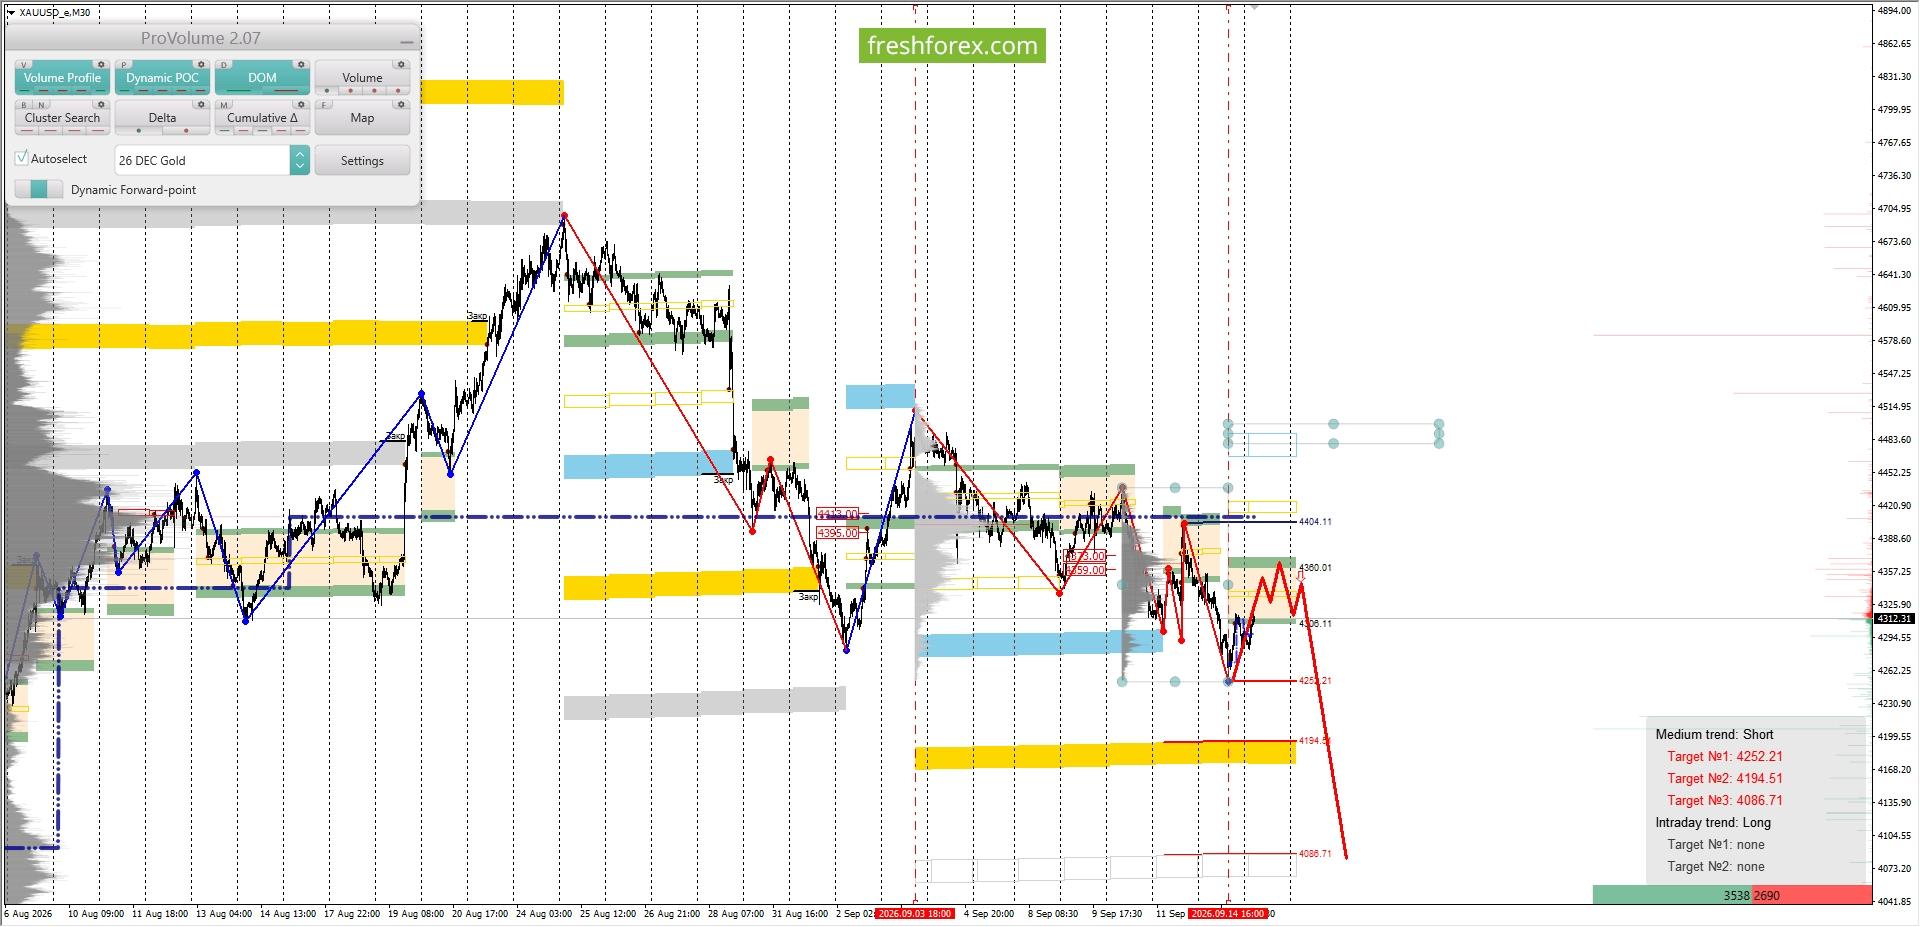
Analysis of margin levels for September 15, 2026 XAUUSD XAUUSD: SELL 4306.11-4360.01, TP1-4252.21, TP2-4086.71. A month without swaps on majors! Learn more Long-term trend: long. The maximum accumulation of volumes for the current contract is located in the range with quotes 4395.00–4430.00. Currently, investment operations on XAUUSD are being carried out below this range, which indicates weakness among buyers. Medium-term trend: short. The maximum accumulation of volumes for the medium-term trend is located in the ranges with quotes 4395.00-4413.00 and 4359.00-4373.00. Currently, investment operations on XAUUSD are being carried out below these ranges, which indicates strength among sellers. The area of favorable prices for selling from the perspective of margin support is located between zones 1/4 and 1/2 constructed from the minimum of 14.09.2026. Quote of the lower boundary of zone 1/4 – 4306.11. Quote of the lower boundary of zone 1/2 – 4360.01. Intraday targets: update of minimums from 14.09.2026 – 4252.21. Medium-term targets: test of the lower boundary of the GWCZ – 4086.71. Trading recommendations: sellouts from the range of favorable prices upon formation of a reversal pattern. Sell: 4306.11-4360.01, Take Profit 1 – 4252.21, Take Profit 2 – 4086.71. Get a 300% bonus on every deposit of $100 or more and increase your trading volume! You can find more analytical information on our website.
- Yesterday
-
HFMarkets (hfm.com): Market analysis services.
AllForexnews replied to AllForexnews's topic in Fundamental Analysis
Date: 14th September 2026. NASDAQ Falls as AI Concerns, Fed Outlook, and Oil Prices Drive Risk-Off Sentiment. AI companies are clashing with the White House over developing AI products. The NASDAQ fell 1.30% on Monday as Wall Street turn ‘risk-off’ due to a potential AI slowdown. In addition to this, investors turned their attention to key central bank decisions, including the Federal Reserve, Bank of England, and Bank of Japan. The decline is not only seen among tech-stocks, indices globally are trading lower. The worst performing indices are the Nikkei 225, NASDAQ, and the Euro Stoxx 50. The downward pressure seen in the equity market is partially due to the talk of slowing down AI development, but also due to a more hawkish global monetary policy. The market now expects the Federal Reserve and the Bank of Japan to hike by 0.25% this week. The best-performing currencies of the day are the US Dollar, Canadian Dollar and Swiss Franc. The worst-performing are the New Zealand Dollar and Australian Dollar. NASDAQ - AI Slow Down Gets President Trump’s Attention The NASDAQ saw a relatively strong and rare bearish price gap this morning. The decline is a combination of three developing stories: the AI slowdown, higher oil prices, and the upcoming Fed decision. OpenAI was the first major AI company to call for slower development to improve safety and reduce potential future risks. After the comments by OpenAI’s CEO, the NASDAQ saw some decline but was able to bounce back the next day. However, Anthropic has now also taken a similar tone and caught the attention of the White House. As a result, investors are not waiting for clarity, they are selling now and asking questions later. Anthropic CEO Dario Amodei has suggested allowing independent third-party evaluators to assess new AI systems before launch, an approach OpenAI CEO Sam Altman has also said he supports and plans to adopt. The White House has pushed back against calls to slow AI development, with President Trump arguing that maintaining America’s technological lead over China is a priority. Trump acknowledged that some safeguards may be necessary but dismissed warnings around AI, stating that ‘whoever wins AI wins.’ His administration favours industry-led safety measures and opposes restrictions that could slow US innovation or allow China to close the gap. HFM -NASDAQ 3-Hour Chart The NASDAQ's price movement will now depend largely on whether the government and AI companies can calm investors’ nerves. Another key factor will be the Federal Reserve’s guidance on future rate adjustments. The bearish price gap has taken the index down to the key support level. Downward price movement over the past month has been unable to break below this support level. If the price does fall, lower bearish indications are likely to materialise. When monitoring only the daily price movement, the price is forming a descending triangle pattern, which is known to indicate bearish sentiment. In the short term, bearish signals are likely to remain while the price trades below $29,046.85 and strengthen below $29,000.00. US Dollar - Fed and Oil Prices A positive factor for the US Dollar is the expectation for an upcoming interest rate hike and higher oil prices. According to the Chicago Exchange, the possibility of a rate hike from the Federal Reserve on Wednesday evening is 90%. The rate hike is almost fully priced into the market, but not completely. Therefore, the hike could trigger volatility, but the key price drivers will most likely be the Fed’s tone and oil prices. Oil prices have now remained above $100 for almost three days. Oil prices rose sharply at the start of the week, with Brent crude climbing above $108 per barrel as tensions in the Middle East intensified. The main concern is the shutdown of Saudi Arabia’s key East-West pipeline following drone attacks, reducing an important alternative route that bypasses the Strait of Hormuz. Simultaneously, continued Houthi attacks and renewed threats around major shipping routes have increased fears of further supply disruptions. If the Federal Reserve provides a hawkish tone and oil prices remain close to $100 per barrel, the US Dollar could maintain bullish price movement. Of particular interest is the EUR/USD, which has fallen below the support level and is experiencing strong bearish price action. Key Takeaway Points: AI slowdown concerns and White House opposition are increasing uncertainty across the technology sector and weighing on the NASDAQ. Global equity markets are under pressure as investors prepare for potentially more hawkish decisions from major central banks. The US Dollar remains supported by expectations of a Federal Reserve rate hike and elevated oil prices. Brent crude above $100 continues to raise inflation concerns and increase volatility across financial markets. Always trade with strict risk management. Your capital is the single most important aspect of your trading business. Please note that times displayed based on local time zone and are from time of writing this report. Click HERE to access the full HFM Economic calendar. Want to learn to trade and analyse the markets? Join our webinars and get analysis and trading ideas combined with better understanding of how markets work. Click HERE to register for FREE! Click HERE to READ more Market news. Michalis Efthymiou HFMarkets Disclaimer: This material is provided as a general marketing communication for information purposes only and does not constitute an independent investment research. Nothing in this communication contains, or should be considered as containing, an investment advice or an investment recommendation or a solicitation for the purpose of buying or selling of any financial instrument. All information provided is gathered from reputable sources and any information containing an indication of past performance is not a guarantee or reliable indicator of future performance. Users acknowledge that any investment in Leveraged Products is characterized by a certain degree of uncertainty and that any investment of this nature involves a high level of risk for which the users are solely responsible and liable. We assume no liability for any loss arising from any investment made based on the information provided in this communication. This communication must not be reproduced or further distributed without our prior written permission. -
Market Technical Analysis by RoboForex
RBFX Support replied to RBFX Support's topic in Technical Analysis
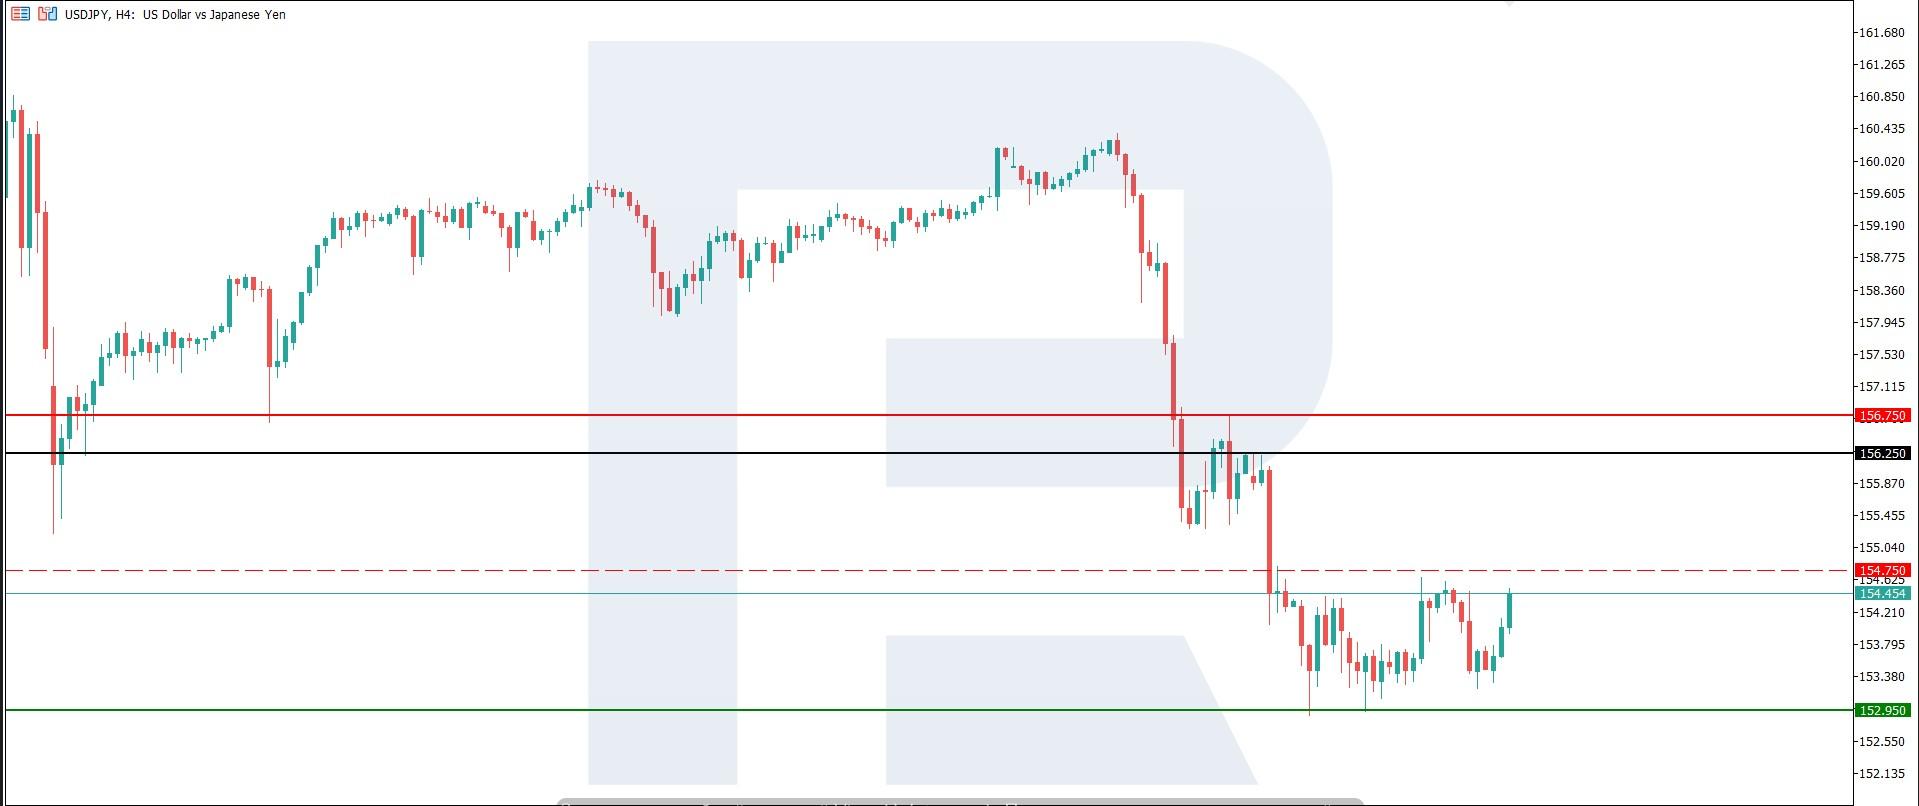
USDJPY tests resistance: the yen gears up for a correction out of the sideways channel The yen's strengthening has stalled, with the USDJPY pair poised for a correction. The USDJPY rate currently stands at 154.45. Technical outlook On the daily chart, the USDJPY pair continues to trade below the previously established 155.15 support level, while a new support level has not yet formed. The outlook for the USDJPY rate remains moderately negative. Read more - USDJPY Forecast Attention! Forecasts presented in this section only reflect the author’s private opinion and should not be considered as guidance for trading. RoboForex bears no responsibility for trading results based on trading recommendations described in these analytical reviews. Sincerely, The RoboForex Team
-
roboforex Market Fundamental Analysis by RoboForex
RBFX Support replied to RBFX Support's topic in Fundamental Analysis
BTCUSD continues to hold key support BTCUSD is under pressure amid growing expectations of a Federal Reserve rate hike, with the price currently hovering at 77,842. BTCUSD forecast: key takeaways The likelihood of a Federal Reserve interest rate hike has risen to 86% Investors are reducing positions in risk assets amid changing expectations for US monetary policy BTCUSD forecast for 14 September 2026: 73,825 Fundamental analysis The BTCUSD price is recovering after testing the key support level at 76,505 USD, although selling pressure persists. The main negative factor for the cryptocurrency market remains the shift in expectations regarding Federal Reserve monetary policy following the release of fresh US inflation data. Additional pressure on Bitcoin comes from outflows from US spot ETFs. From 8 to 11 September, the funds recorded combined net outflows of around 462.6 million USD, marking a notable reversal following strong inflows earlier in the month. RoboForex Market Analysis & Forex Forecasts Attention! Forecasts presented in this section only reflect the author’s private opinion and should not be considered as guidance for trading. RoboForex bears no responsibility for trading results based on trading recommendations described in these analytical reviews. Sincerely, The RoboForex Team -
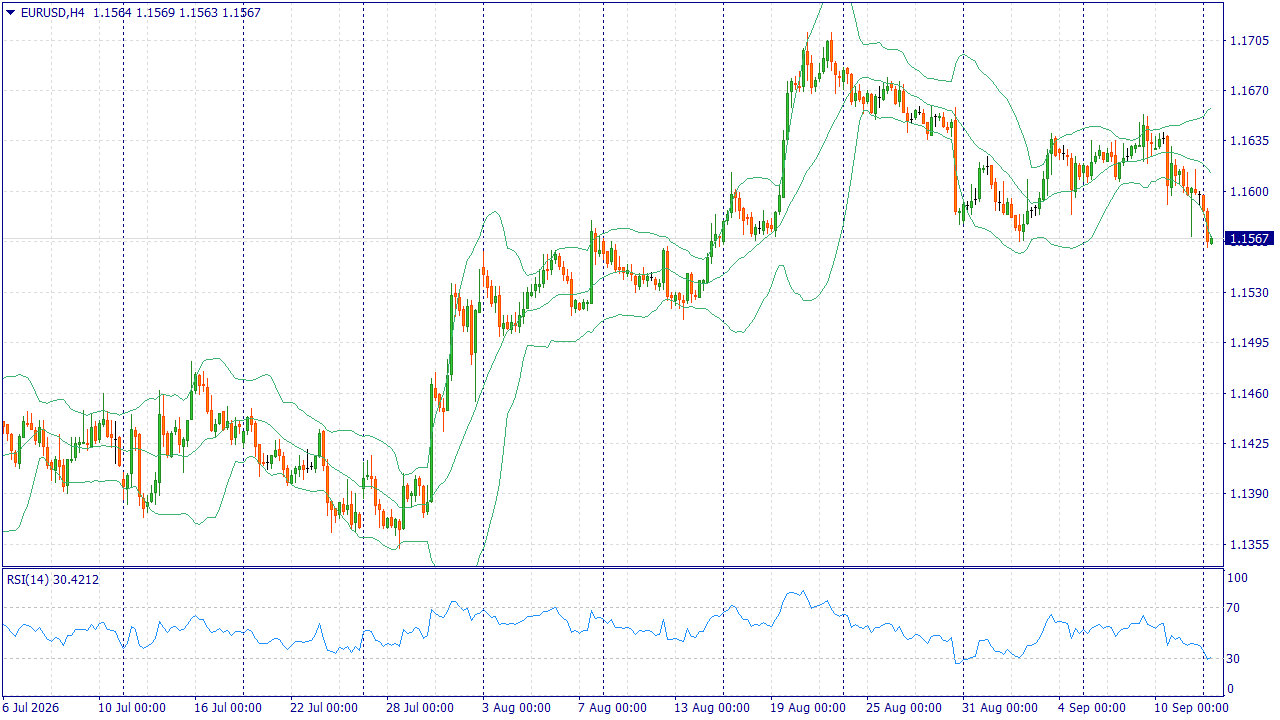
 Fundamental Market Analysis for September 14, 2026 EURUSD EURUSD: A month without swaps on majors! The euro begins the week after the ECB raised its interest rate by 25 basis points. The regulator raised the deposit facility rate to 2.50% and indicated that inflation will remain above target longer than expected. This supports the euro, but the effect of the decision is already partially priced in by the market, while rising energy costs simultaneously increase risks for the eurozone economy. The American side of the pair received a fresher impulse following August's inflation data. Rising consumer prices strengthened expectations of an FOMC rate hike at the September 15–16 meeting, and US Treasury yields are holding near multi-year highs. This gives the dollar an advantage ahead of the regulator's decision, especially given investors' cautious risk appetite. As a result, support from the ECB for the euro currently does not outweigh the reassessment of the Fed's trajectory. Expensive energy further complicates growth prospects for the eurozone, while the expectation of a US rate hike remains a relevant driver for the current session. Against this backdrop, the priority remains a decline in EUR/USD. Trading idea: SELL 1.1595, SL 1.1630, TP 1.1515 You can find more analytical information on our website.
- Last week
-

VIP Membership - FREE upgrade for OLD and ACTIVE Members
rgeholt00 replied to MrAdmin's topic in Announcements
Please can you ad me, thank you -
Welcome to Indo-Investasi.com. Please feel free to browse around and get to know the others. If you have any questions please don't hesitate to ask.
-
 akhalidmh90 joined the community
 -
 Siigus joined the community
 -
How far do you have to be in the closing price to make you a winner? And how long of a time do they give you for the bet to be valid?
-
I would also like copy,if available?
-

VIP Membership - FREE upgrade for OLD and ACTIVE Members
Traderbeauty replied to MrAdmin's topic in Announcements
Hi Kimsam You are now a VIP Thank you for all your previous support. Jane -
 Bocas joined the community
 -

VIP Membership - FREE upgrade for OLD and ACTIVE Members
⭐ KimSaM replied to MrAdmin's topic in Announcements
Me too .. can be added ? -
 heluiz joined the community
 -
Welcome to Indo-Investasi.com. Please feel free to browse around and get to know the others. If you have any questions please don't hesitate to ask.
-
 outoforder84 joined the community
 -
 Abasiofon joined the community
 -
Welcome to Indo-Investasi.com. Please feel free to browse around and get to know the others. If you have any questions please don't hesitate to ask.
-
 jackvoo2026 joined the community
 -
Welcome to Indo-Investasi.com. Please feel free to browse around and get to know the others. If you have any questions please don't hesitate to ask.
-
 James Vince joined the community
 -
Anyone here a paid member of forexeapro.com? This course is available for download on their site. PM me if you can get it.
-
roboforex Market Fundamental Analysis by RoboForex
RBFX Support replied to RBFX Support's topic in Fundamental Analysis
US Tech rebounds from the lower boundary of the consolidation range The US Tech is attempting to end a three-day losing streak, with the price currently at 29,279. US Tech forecast: key takeaways Expectations for Federal Reserve rate cuts are being reassessed, increasing risks for the technology sector High oil prices are intensifying inflation risks, which could limit the Federal Reserve’s room to ease monetary policy Fundamental analysis The US Tech index is attempting to recover after declining for three consecutive trading sessions. The price has almost reached the key support level at 29,000 and is attempting to recoup yesterday’s losses. Pressure on the technology sector increased after US government bond yields rose and stronger-than-expected wholesale price data was released. The primary driver of the previous session’s sell-off was an acceleration in the annual growth rate of the US Producer Price Index (PPI) to 5.4% in August. RoboForex Market Analysis & Forex Forecasts Attention! Forecasts presented in this section only reflect the author’s private opinion and should not be considered as guidance for trading. RoboForex bears no responsibility for trading results based on trading recommendations described in these analytical reviews. Sincerely, The RoboForex Team