


All Activity
- Past hour
-
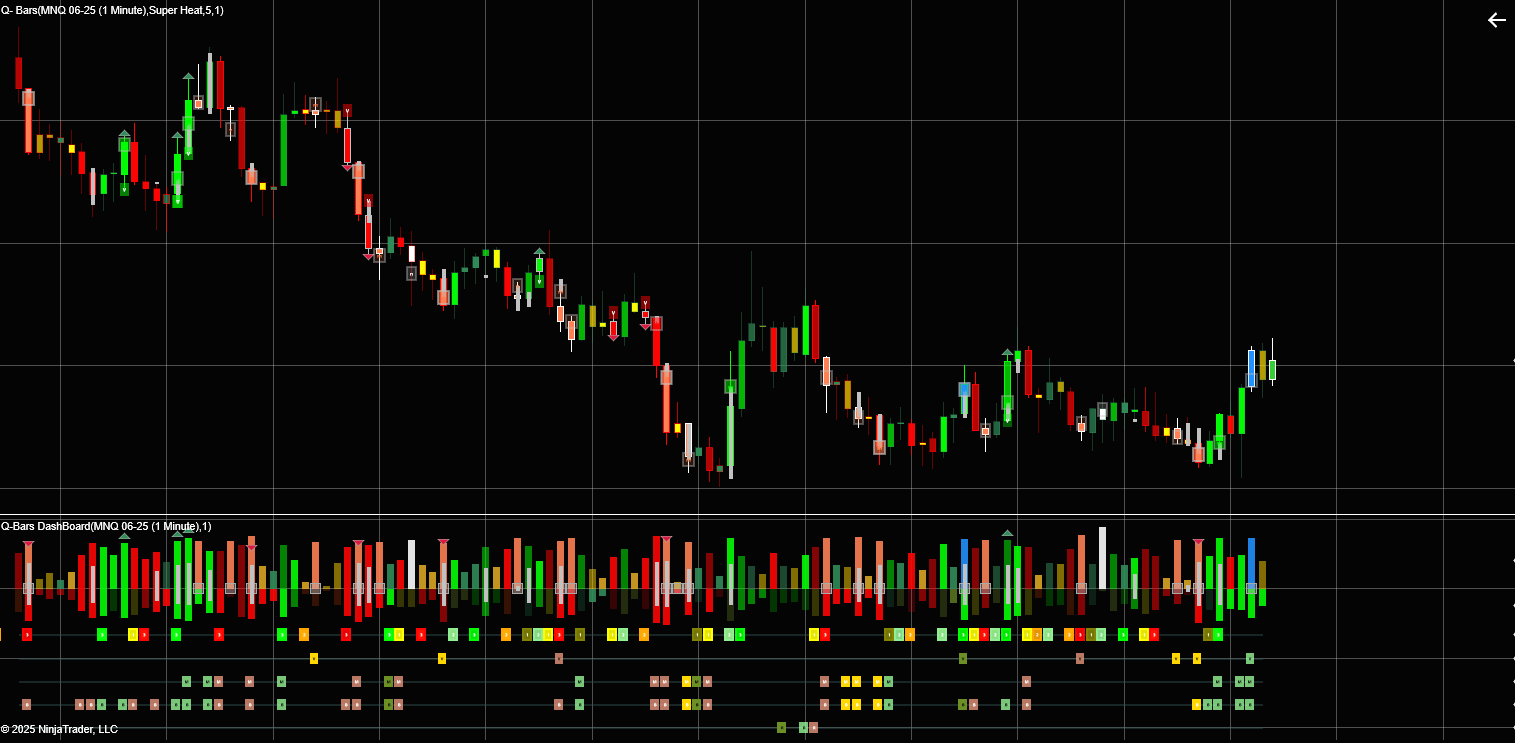
Q-Bars Smart Bars analyses the interest ( Volume and other variables) to show us areas of support and resistance as well as areas of No interest. These are levels where the interest dries up, Kind of the calm before the storm. Heat is mostly focused on measuring the Momentum and Trend variables. Showing us how strong or weak these variables are. We have also added our Power Wicks indicator to the mix. This indicator looks at the delta of buying and selling pressure and the shifts therein. Combining these indicators allow us to get the right information regarding the Smart Money Volume Flow , The Momentum , High Interest and No interest Levels , Trend strength , Momentum , Delta and more. When we put it all together we get some really good trading signals. The Market tends to move between areas of interest and No interest, Momentum or Trend, and then areas of Support and Resistance. Absorption and Distribution. Momentum and Reversion. Multi Time-Frame We get this information for every bar but we also look at this information at larger scales. We use the info gathered intra-bar to define trends and then measure this information on a larger “trend scale” The information that we get form individual bars give us the information at a Micro scale. Then we add these up in individual trends to give us information about the Macro scale. 4 Bar Types We define 4 unique bar types to explain these variables: Volume Bars (High Interest Bars) No Interest Bars Momentum Bars Balance Bars We then assign colors for all the bars in between according to their “heat” or their significance in terms of all the variable that we are interested in. These colors range from light colors to darker colors showing how significant these bars are. To learn more about this amazing tool visit: https://quaderr.com/q-bars/ See what our happy clients are saying about this tool: Detailed Review: "My journey in trading spanned 15 years, marked by persistent challenges in achieving consistent profitability. That trajectory shifted dramatically upon discovering Quaderr Indicators. Jaco, through his innovative Q Bar and Q Bar Dashboard, has truly been a 'lifesaver,' fundamentally altering my perspective on market analysis and dynamics. The Q Bar and Q Bar Dashboard are, in my experience, exceptionally potent tools. They form the core of a highly effective and robust trading system that I've found to perform remarkably well across diverse market environments. What truly sets these indicators apart is their unique ability to simplify complex market data, presenting it with a clarity that fosters actionable insights. Beyond the sophisticated design of the indicators themselves, Jaco's commitment to user education is highly commendable. He has meticulously ensured that I possess a thorough and practical understanding of how to leverage his tools effectively. This focus on clear instruction and the intuitive craftsmanship embedded in each indicator speak volumes about his dedication to empowering traders. I am immensely thankful and grateful to Jaco for generously sharing his profound knowledge and invaluable tools. For any individual aspiring to become a professional trader, I unequivocally recommend Quaderr Indicators as a truly special and transformative resource." Sincerely, Don Harris

-
 Bill A reacted to a post in a topic:
Speculator@Seth
Bill A reacted to a post in a topic:
Speculator@Seth
-

HFMarkets (hfm.com): Market analysis services.
AllForexnews replied to AllForexnews's topic in Fundamental Analysis
[b]Date: 13th June 2025.[/b] [b]Israel Attacks Iran in An Overnight Strike: Oil Rises 13%![/b] Israel launched attacks on Iran's nuclear facilities, military leadership and key Iranian scientists according to reports. The attack took place overnight and involved more than 200 Israeli fighter jets which bombed more than 100 targets. The US has made a statement publicly advising the country was not involved. In addition to this, other key partners such as the UK and France are pushing for de-escalation. How is the market reacting so far? Crude Oil Prices Jump 13% The asset which is seeing the most volatility is understandably Crude Oil as Iran is the 7th highest producer of Crude Oil after Iraq. Currently, the price of Crude Oil is trading 5.00% higher, but earlier in the day it was 13% higher. Crude Oil rose to a high of $77.64 per barrel and to its highest price since January. Due to extremely high volatility in a short period, it is understandable that the asset became oversold triggering a decline in the past 3 hours. Currently, the bearish momentum continues to remain the driving force in the short term. The 200-period SMA continues to act as a trend-line meaning the price may continue to decline to $70.50 before finding support. However, this would also depend on the upcoming developments. According to reports, the Israeli army not only attacked nuclear facilities, military leadership and key Iranian scientists, but also the country’s ability to instantly retaliate. As a result, Iran was limited to using drones to retaliate. According to army experts, drones can travel long distances and cause significant damage, but they travel extremely slowly. The Israeli government is advising they are currently shooting down drones over Jordan and Syria. Crude Oil Daily Chart If the conflict was to escalate, the price of Oil could regain bullish momentum as it would trigger a fear of supply chain disruptions and lower production levels. SNP500 - Developments Trigger Low Risk Appetite! The SNP500 fell as much as 1.98% before retracing higher. Currently, the SNP500 is trading 1.20% lower and the NASDAQ 1.33%. The downward price movement is being triggered by 2 factors. The first is the conflict between Israel and Iran prompting a lower risk appetite. The second is the significantly higher oil prices which can apply upward pressure on inflation. The future price movements of the SNP500 and stock market in general will depend on how the current situation escalates. If the two countries escalate, the price of Oil may continue to rise while the stock market potentially could take a larger hit. If downward pressure increases, a key support level for the index could be seen at $5,791.24. This level may act as a target for individuals looking to speculate downward momentum in the medium-term. Traders should note that even though the index is yet to witness significant lasting volatility, most risk indicators point to a ‘risk off’ sentiment. For example, the VIX Index currently trades 9% higher. Gold - Safe Haven Asset Witness Increased Demand! The price of Gold has not only risen due to the Israeli strikes on Iran, but has been increasing in value for 3 consecutive days. Originally, lower inflation data drove the upward price movement, prompting a weaker US Dollar. Gold is inversely correlated with the US Dollar. However, now the commodity’s safe haven status is coming into play as institutions look to lower the risk of their portfolios. Key Takeaway Points: Oil prices spiked 13% due to the Israeli strikes, reaching $77.64, with potential decline to $70.50 if bearish momentum continues. The SNP500 fell 1.98% as the conflict escalated, and rising oil prices raised inflation concerns. Gold has been increasing for the last three days, driven by the weaker US Dollar and its safe-haven appeal amid the crisis. [b]Always trade with strict risk management. Your capital is the single most important aspect of your trading business.[/b] [b]Please note that times displayed based on local time zone and are from time of writing this report.[/b] Click [url=https://www.hfm.com/hf/en/trading-tools/economic-calendar.html][b]HERE[/b][/url] to access the full HFM Economic calendar. Want to learn to trade and analyse the markets? Join our webinars and get analysis and trading ideas combined with better understanding of how markets work. Click [url=https://www.hfm.com/en/trading-tools/trading-webinars.html][b]HERE[/b][/url] to register for FREE! [url=https://analysis.hfm.com/][b]Click HERE to READ more Market news.[/b][/url] [b]Michalis Efthymiou HFMarkets[/b] [b]Disclaimer:[/b] This material is provided as a general marketing communication for information purposes only and does not constitute an independent investment research. Nothing in this communication contains, or should be considered as containing, an investment advice or an investment recommendation or a solicitation for the purpose of buying or selling of any financial instrument. All information provided is gathered from reputable sources and any information containing an indication of past performance is not a guarantee or reliable indicator of future performance. Users acknowledge that any investment in Leveraged Products is characterized by a certain degree of uncertainty and that any investment of this nature involves a high level of risk for which the users are solely responsible and liable. We assume no liability for any loss arising from any investment made based on the information provided in this communication. This communication must not be reproduced or further distributed without our prior written permission. - Today
-
⭐ RichardGere reacted to a post in a topic:
Multi-Timeframe Fu$ion
-
your pic is delta reversal from sierachart The footprint indicator from TradeDevils for NT8 can also point out delta reversal and even more Hope this is what you looking
-
Read more
Welcome to Indo-Investasi.com. Please feel free to browse around and get to know the others. If you have any questions please don't hesitate to ask.
-
⭐ Mestor reacted to a post in a topic:
Speculator@Seth
-
In my experience, choosing a broker with solid local support and clear communication channels really makes a difference in daily trading. When the broker’s customer service speaks your language and operates in your time zone, A trusted, regulated broker with offices or representatives nearby also gives extra peace of mind, especially if you need help with account setup or deposit and withdrawal questions. Before committing real money, it’s always smart to open a demo account first this way you can learn the platform’s features, test order execution speed, and check the spread conditions under live market data without any risk.
-
 Maxiprofit Development joined the community
 -
Does someone have this indicator from SPYMONEY as it is not in the cracked version : SpyBot Double Indicator v 1 Thank you
-
⭐ aniketp007 reacted to a post in a topic:
Speculator Seth
-
techfo reacted to a post in a topic:
Speculator@Seth
-
⭐ aniketp007 reacted to a post in a topic:
Speculator@Seth
-
TRADER reacted to a post in a topic:
Multi-Timeframe Fu$ion
-
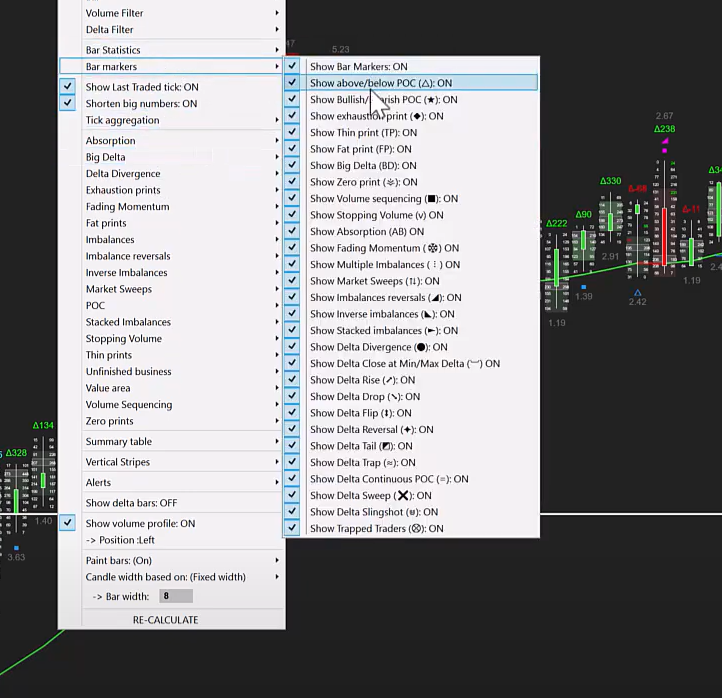
Could you share with me why you think these are "amazing"?
- Yesterday
-
try this .. not tested. https://limewire.com/d/KR1Xa#819lJ6LXrW
-

Req: Lance Breitstein's Magnum Opus course
roddizon1978 replied to ⭐ emptyhead's topic in Forex Clips & Movie Request
You remind me to take a look on this, I have download this 2 months ago, and still have not seen it yet, curious, if he tell his secret. Is he the Guy living in Abu Dhabi ? -
⭐ rcarlos1947 reacted to a post in a topic:
Speculator@Seth
-
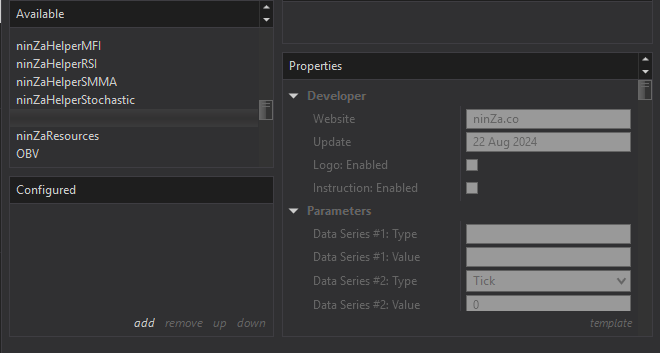
I am assuming that you already have some other NinzaCo indicators on your computer, yes?
-
fxtrader99 reacted to a post in a topic:
Speculator@Seth
-
SPAR reacted to a post in a topic:
bars needs to unlock
-
Thank you @kimsam
-
its work man thanks @kimsam
-
edu .. not tested yet .. please confirm if works .. https://workupload.com/file/64acJSQxrwj
- 1 reply
-
- 11
-
-

Req: Lance Breitstein's Magnum Opus course
⭐ MOF NET replied to ⭐ emptyhead's topic in Forex Clips & Movie Request
ooooh man, it's about 30 GiB , you are lazy to make telegram account, and ask for reupload it on other server that it will be dead so soon!!! give some effort man don't be lazy 😁 click on the above link you will go to the exact links it's about 22 files to download -
I have done just that despite is never too much remember, but after import the indcator, replace the resource file an restart ninjatrader I get an empty line as can be seen on the attached image. Did you successfuly installed the indicator? If you did I don't know what I can be doing wrong on my end.
-
Try it and let me know if this works. https://limewire.com/d/ANeh1#dXdNDyU5f4 The trick is to replace the Resource file when asked during installation.
-
From my trading desk, limit orders helped me enter at precise levels, while stop orders kept me safe against sharp reversals. Learning OCO saved me from overexposure—two orders in place but only one filled is pure peace of mind
-
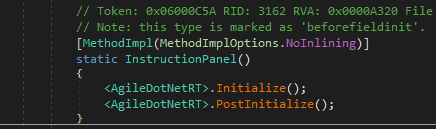
Agiledotnet is the hard one.
-
yes I second that, the ninza co Multi-Timeframe Fu$ion if we can get some help removing the agile.net protection.
-
May be your best your best bet getting it! clubbingbuy.com/threads/quant-alpha-trading-system.2376/
-
Is this still working i'm running into incompatible issues
-
Amazing pack of indicators https://www.speculatorseth.com/downloads.html https://www.speculatorseth.com/downloads/SpeculatorSethElite3410.zip https://www.speculatorseth.com/detail.html Trial needs to be unlocked
-

Req: Lance Breitstein's Magnum Opus course
N1ck1 replied to ⭐ emptyhead's topic in Forex Clips & Movie Request
If there's actually a download link from Telegram it would be awesome if someone can directly provide it for those who don't have a login to access. TY! -
@fxtrader99 I thank you for the share unfortunately its not exactly what I was looking for. The interest on multi-timeframe fu$ion is that it can use time-frames that are not only minutes but also can be integrated on strategies. However once again thank you.


.thumb.png.d2342df9e4522b7908d9f6e3a988646f.png)