All Activity
- Past hour
-

roboforex Market Fundamental Analysis by RoboForex
RBFX Support replied to RBFX Support's topic in Fundamental Analysis
Bostic decides the fate of USDCAD: decline or reversal Bostic’s speech could trigger a decline in USDCAD quotes towards 1.3610. Discover more in our analysis for 30 June 2025. USDCAD forecast: key trading points The Canadian government cancelled the digital tax Speech by Federal Open Market Committee (FOMC) member Raphael W. Bostic USDCAD forecast for 30 June 2025: 1.3610 Fundamental analysis Today’s forecast for USDCAD is optimistic for CAD. As part of the resumption of broad trade negotiations between the US and Canada, the Canadian government cancelled the digital tax, thus taking a step towards the US. Against this backdrop, the Canadian dollar continues to strengthen. The USDCAD forecast also considers that Federal Open Market Committee (FOMC) member Bostic will give a speech, which may influence the USDCAD rate. RoboForex Market Analysis & Forex Forecasts Attention! Forecasts presented in this section only reflect the author’s private opinion and should not be considered as guidance for trading. RoboForex bears no responsibility for trading results based on trading recommendations described in these analytical reviews. Sincerely, The RoboForex Team - Today
-
I tried Viper a while back and didn’t stick with it long—it just didn’t feel solid to me. Ended up checking out some alternatives and stumbled on https://axiomtrade.xyz/what-is-axiom-exchange/ while looking for something that made more sense. It gave me a clearer idea about how certain trading platforms actually work and what I should be looking for.
-
 HappyHarry3 reacted to a post in a topic:
Timingsolution & Nifty Updates - 3
HappyHarry3 reacted to a post in a topic:
Timingsolution & Nifty Updates - 3
-
⭐ iatin reacted to a post in a topic:
Simpler Trading / Simpler Options courses
-
Ninja448 reacted to a status update:
Welcome to Indo-Investasi.com. Please feel free to browse around and get to know the
-
⭐ goldeneagle1 reacted to a post in a topic:
Need to unlock this beast indicator please
-
⭐ goldeneagle1 reacted to a post in a topic:
ninza "Magical TMA Bands"
-
 adonis reacted to a post in a topic:
Looking for Jigsaw for NinjaTrader – Really Need It!
adonis reacted to a post in a topic:
Looking for Jigsaw for NinjaTrader – Really Need It!
-
⭐ jinjunk reacted to a post in a topic:
Req: Lance Breitstein's Magnum Opus course
-
adonis reacted to a post in a topic:
TDU Footprint & Footprint Trader 2.0.0.12 beta 3
-
adonis reacted to a post in a topic:
Need to unlock this beast indicator please
-
no more bragging, hints pls
-
nah bro...I don't say that.....if u check money flow by lux algo..u can find delta with volume...most of the time those delta are mostly LQ...the indicator RM Traders plot those line most probably which are outside of the price range....the way u find lines with composite volume profile HVN or LVN...this indicator find the highest delta for buyer and seller...and if those are supported or breakout that really means something happening on the market....unlike traditional support or resistance which doesn't make any sense to me....as u know market doesn't care those support and resistance line....they care about auction and money flow.....support and resistance works sometimes because people buy or sell there most of the time....but sometimes it doesn't work...bcz of the auction process
-

[Req] - Urb@n F0rex PA course?
⭐ jinjunk replied to marketrulez's topic in Forex Clips & Movie Request
Would someone kindly re-upload the 4 course bundle. Thanks in advance. -

Need to unlock this beast indicator please
Ninja_On_The_Roof replied to Tasfy's topic in Ninja Trader 8
Ahh, I must be an idiot then. -
Please re-upload. Thanks for your kindness.
-
there are talents on the forum who could make the solution for Ninja Indicators
-
they are not traditional support or resistance mate....they are LQ lines...if you know bookmap...u can understand how useful those are....
-
Haven't tried this. Not sure if EDU. https://workupload.com/file/ASY4tj9zqXf
-
This file doesn't work...still u can try..if anyone have the manual trading file please educate NT8 Viper Trading.7z
-
Anyone have?
-
Thank You Kesk.
- Yesterday
-
 Ninja448 joined the community
 -
TDU Footprint & Footprint Trader 2.0.0.12 beta 3
Ninja_On_The_Roof replied to ⭐ rcarlos1947's topic in Ninja Trader 8
Awesome topics and answers guys.😇 -
 Hello Everyone 😊 Can anyone please share Market Stalkers Level 1,2,3 course by Deeyana Angelo. That'll be much appreciated. Thanks & Good Day 😊
 -
Need to unlock this beast indicator please
Ninja_On_The_Roof replied to Tasfy's topic in Ninja Trader 8
Where are the files? Very first glance at it, looks like just support resistance break. -
Thank you Kesk for your all your help over this period of time. Most appreciate it.
-

TDU Footprint & Footprint Trader 2.0.0.12 beta 3
⭐ rcarlos1947 replied to ⭐ rcarlos1947's topic in Ninja Trader 8
I think you and I were referencing the earlier versions of TDU Footprint (TDUFootPrint v1.0.0.x) which what you say is true. But later versions like TDUFootPrint v1.0.1.28 and above will display in the Data Display tab and will be available for Strategy Builder and similar programs. Thank you for the clarification. And as I said, I continue to learn. -

TDU Footprint & Footprint Trader 2.0.0.12 beta 3
misalto replied to ⭐ rcarlos1947's topic in Ninja Trader 8
better to get algo studio pro instead of coding all those patterns wich i think will be a waste of time
-
TDU Footprint & Footprint Trader 2.0.0.12 beta 3
misalto replied to ⭐ rcarlos1947's topic in Ninja Trader 8
you got it wrong they come seperate you will need to pair exact same settings between footprint is for visual and footprint plots is for strategie builder -
TDU Footprint & Footprint Trader 2.0.0.12 beta 3
⭐ rcarlos1947 replied to ⭐ rcarlos1947's topic in Ninja Trader 8
@misalto, they all have symbols that display on the chart, but if you look at the indicator in the Data Display Tab, none are displayed. If you double click on any symbol, nothing appears, which means that you may not be able use them in StrategyBuilder or similar algo builders. Although, TDU does permit you to create your own strategies with their TDUAlgoStudioPro. If you have any suggestions, I appreciate your input as I am always in learning mode. -

TDU Footprint & Footprint Trader 2.0.0.12 beta 3
Traderbeauty replied to ⭐ rcarlos1947's topic in Ninja Trader 8
Thank you so much, that was really enlightening and very detailed. Thx -
TDU Footprint & Footprint Trader 2.0.0.12 beta 3
misalto replied to ⭐ rcarlos1947's topic in Ninja Trader 8
tdu has many too much i think patterns all of them have plots you can copy and build conditions -
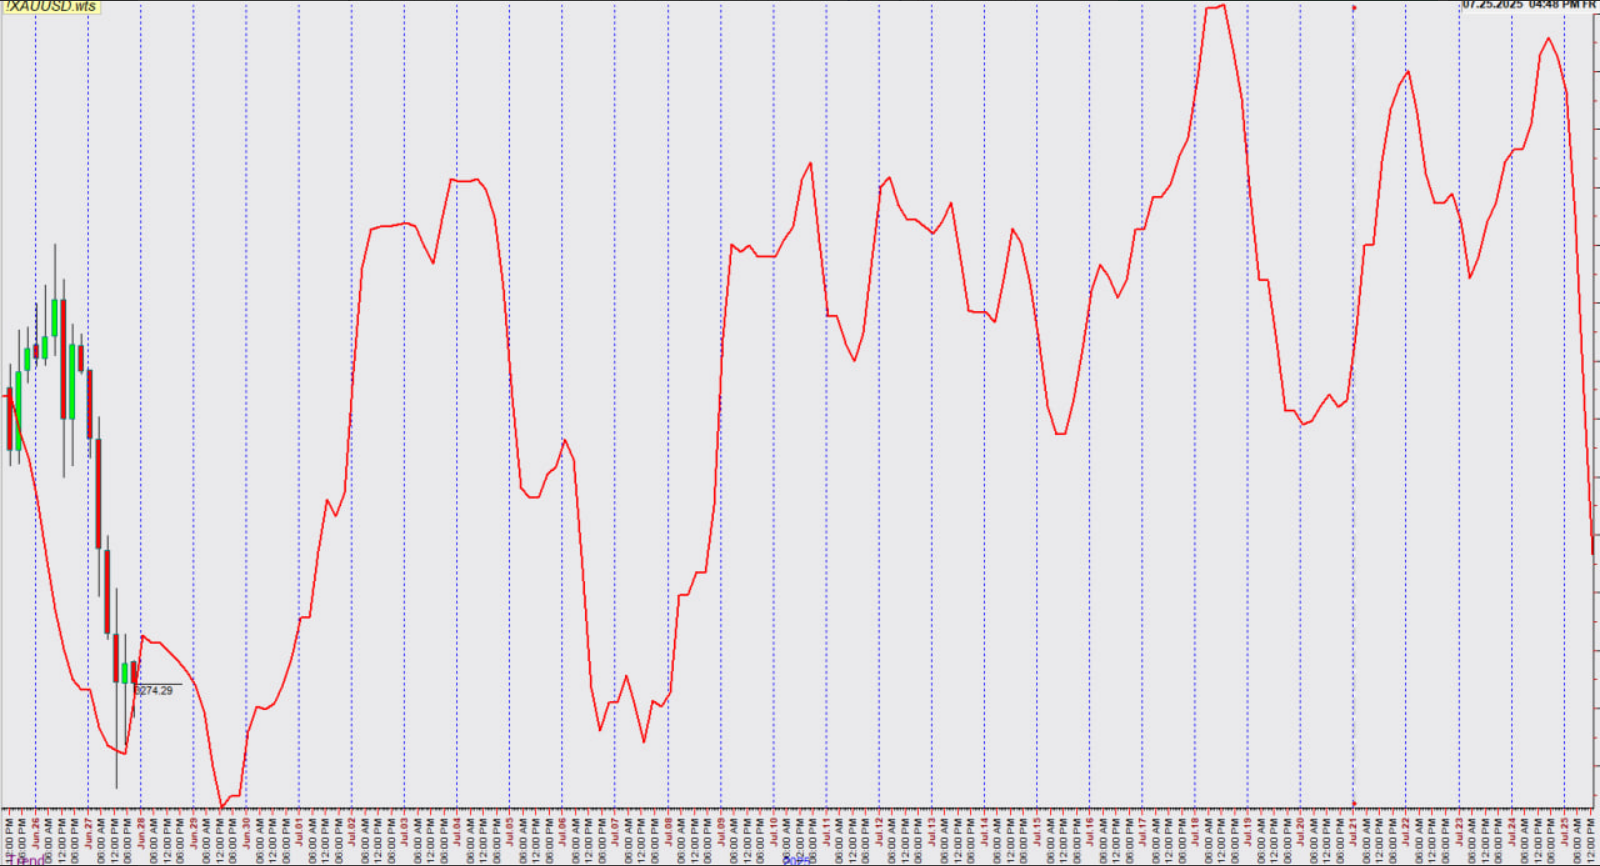
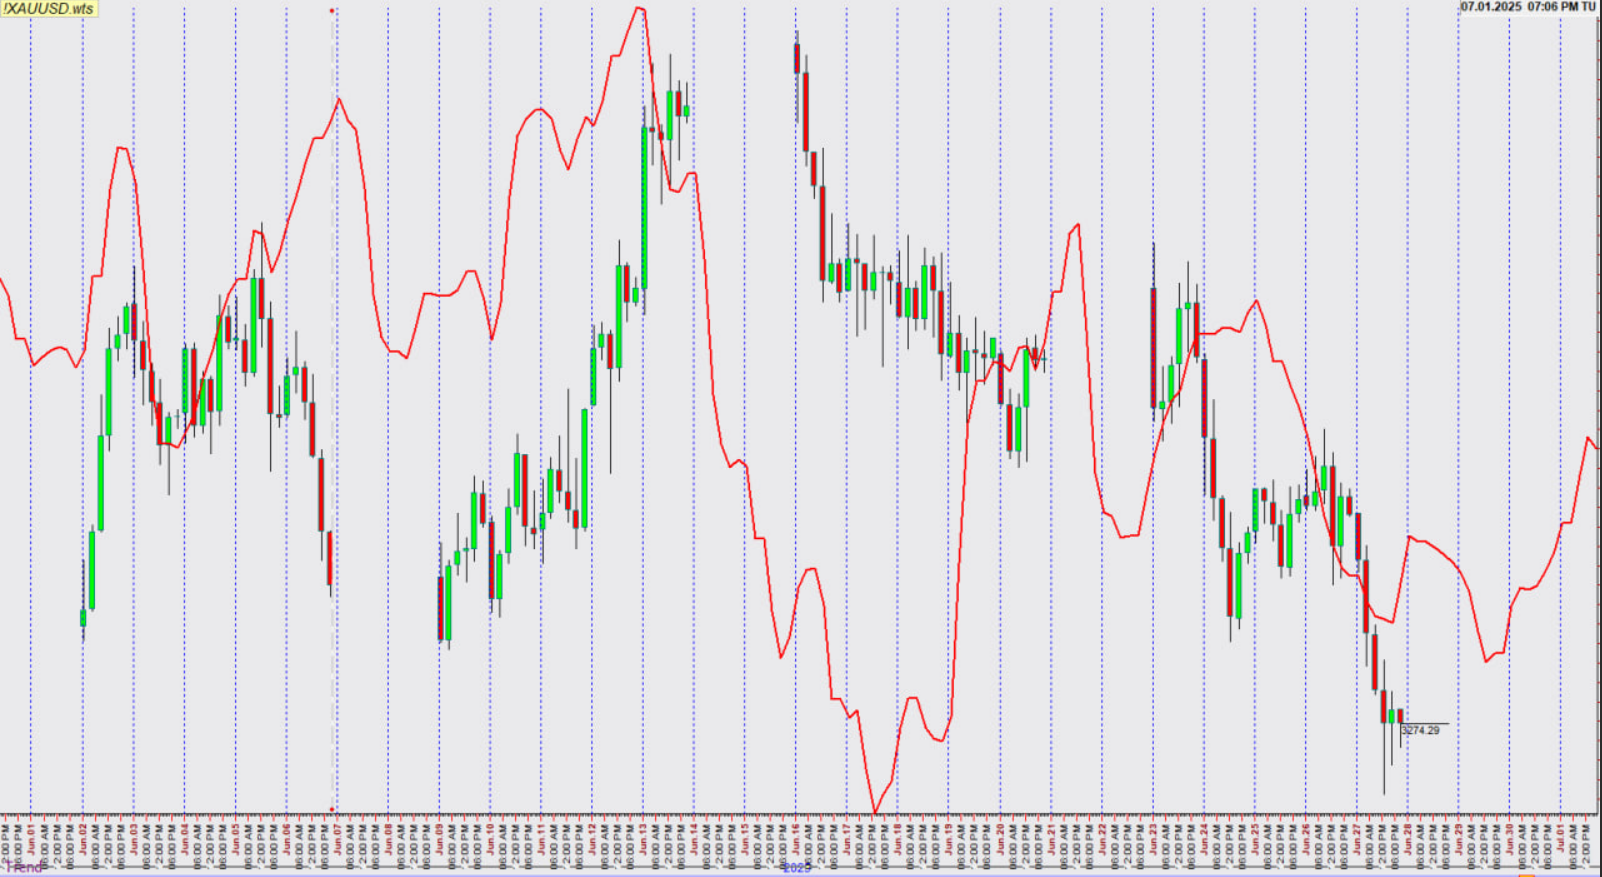
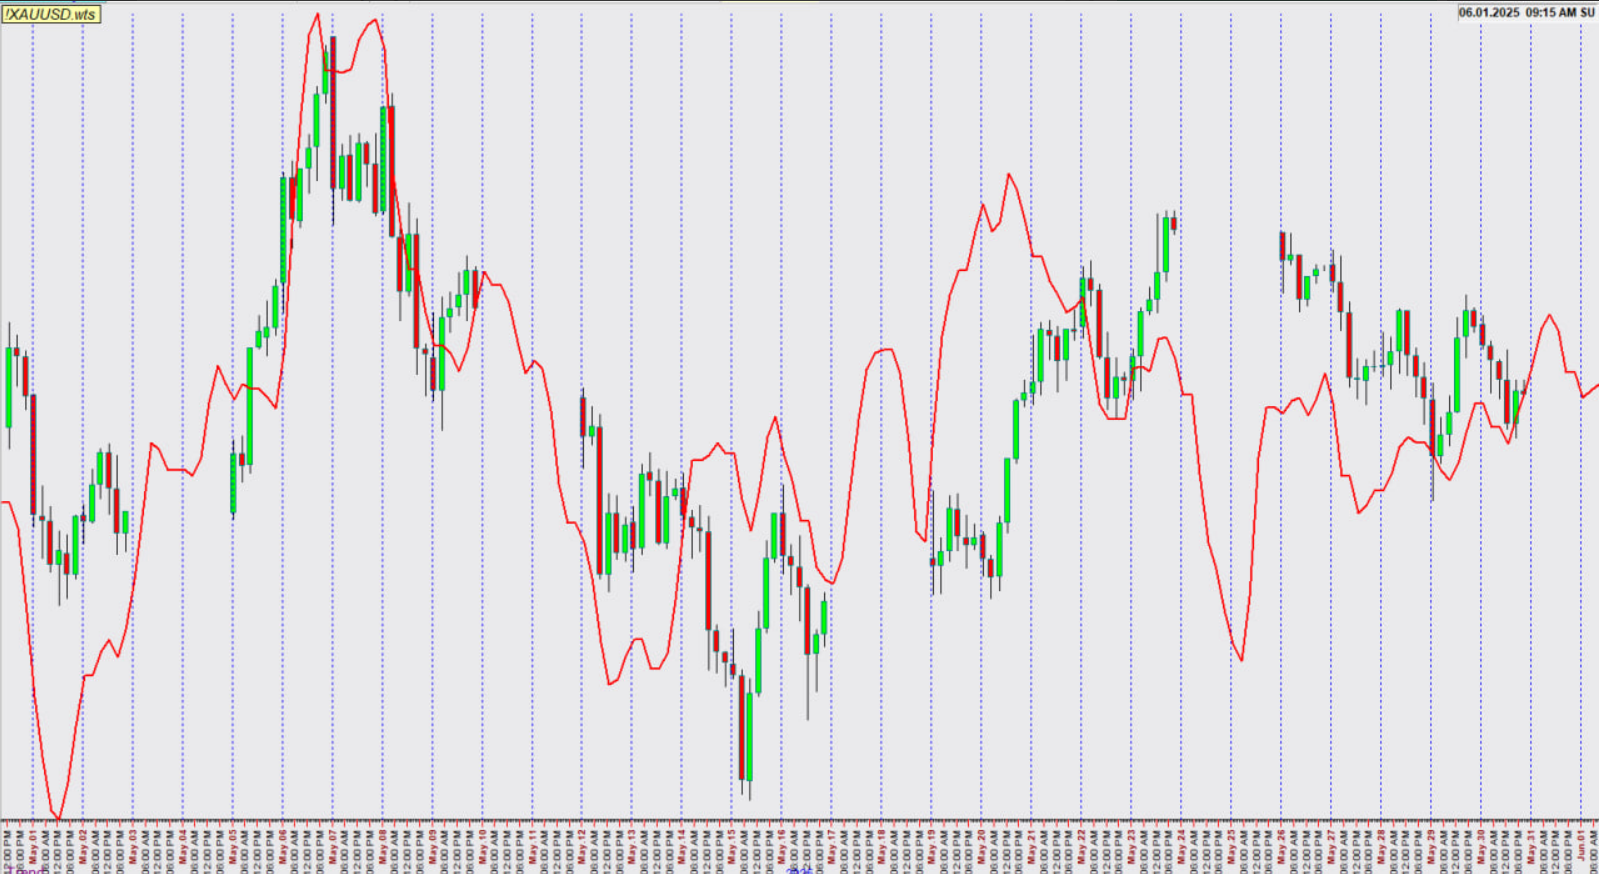
XAUUSD H4 July 2025 Forecast also attached result of May and June 2025


.png.aa069f64cf5c3abbf01ae332b8e15c5e.png)