⤴️-Paid Ad- Check advertising disclaimer here. Add your banner here.🔥
All Activity
- Past hour
-
Hi bro, do you happen to have sonarlike iceberg finder which works with these resources as well?
-
 Eva Grey reacted to a post in a topic:
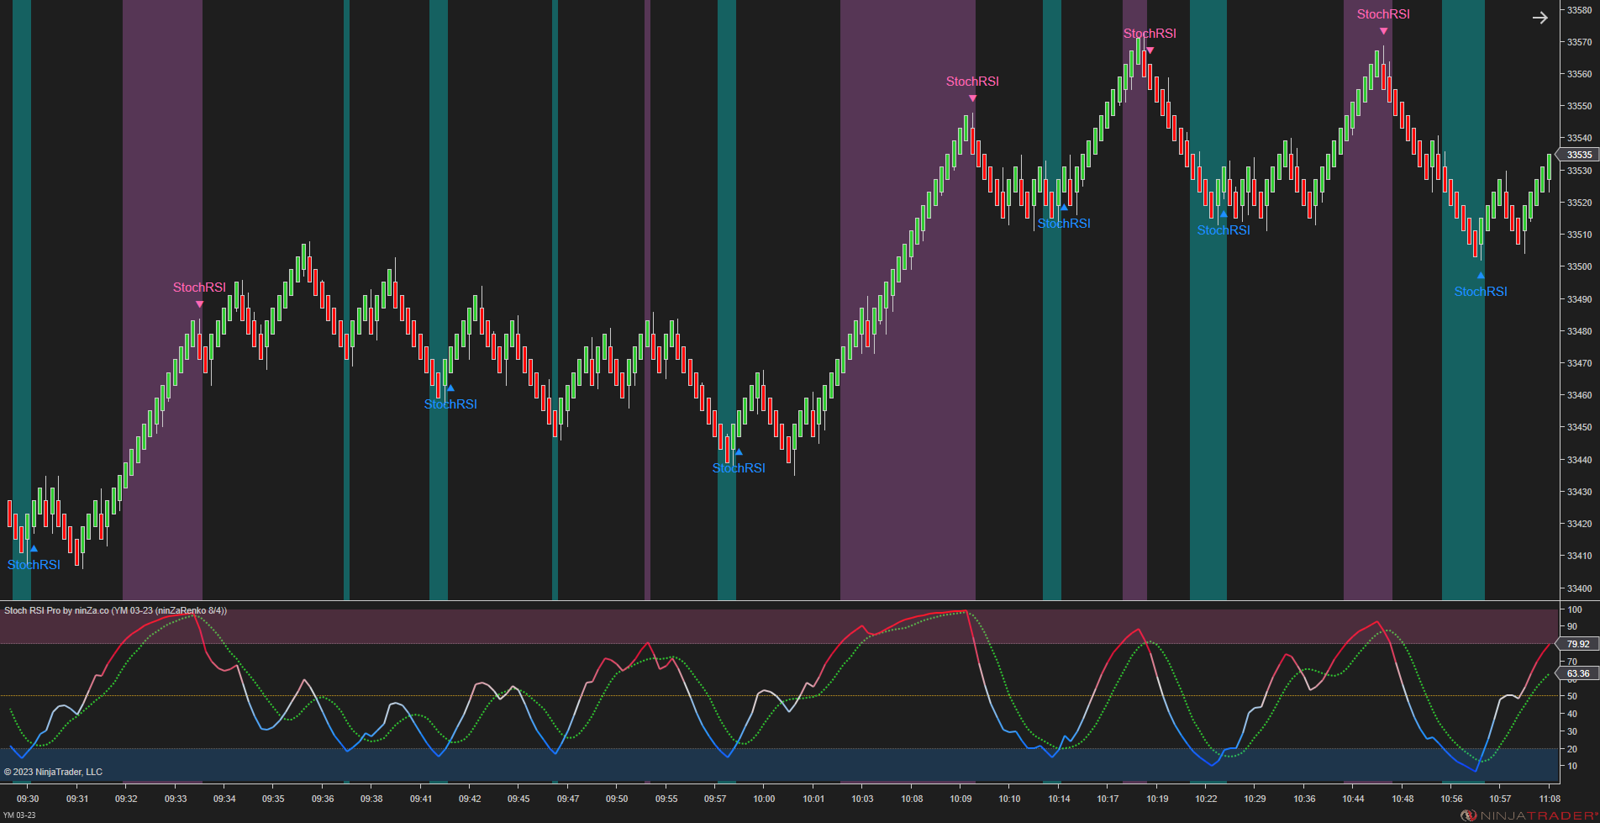
NinZa StochRSI Pro
Eva Grey reacted to a post in a topic:
NinZa StochRSI Pro
-
wow it works! Thanks bro!
-
 LoneBladeRGC reacted to a post in a topic:
NinZa StochRSI Pro
LoneBladeRGC reacted to a post in a topic:
NinZa StochRSI Pro
-
fxtrader99 reacted to a post in a topic:
NinZa StochRSI Pro
-
Predict reacted to a status update:
Welcome to Indo-Investasi.com. Please feel free to browse around and get to know the
-
Working with these resources https://workupload.com/file/PfkMCy687mr
-
⭐ rcarlos1947 reacted to a post in a topic:
NinZa StochRSI Pro
- Today
-
Thanks Eva, unfortunately can't get it to work with NT9 resource file.
-
LoneBladeRGC reacted to a post in a topic:
NinZa StochRSI Pro
-
dex reacted to a post in a topic:
NinZa StochRSI Pro
-
LoneBladeRGC reacted to a post in a topic:
StochRSI Pro
-
https://workupload.com/file/4edGawXGBDQ

-
New additions to VIP: askedgar.io fiscal.ai
-

tradewithraja bot last version needs to educate,
Liwulong replied to TRADER's topic in Ninja Trader 8
Thanks -

HFMarkets (hfm.com): Market analysis services.
AllForexnews replied to AllForexnews's topic in Fundamental Analysis
Date: 24th February 2026. Gold Surges on Monetary Policy Risks, Tariff Risks, and Iran-US Tensions. Gold prices climbed to their highest level for February. Investors are driving the rally as they price in monetary policy risks, tensions with Iran, and new tariffs. Gold prices saw one of their strongest declines in history towards the end of January. However, the recent upward price movement the asset has witnessed in recent days has resulted in a 71% correction. Inflation and Monetary Policy Risk Higher inflation tends to trigger weaker Gold prices as investors expect the US Dollar to rise and the Federal Reserve to take a hawkish stance. However, the latest Core PCE Price Index, which read higher than expectations, is more complex. The US on Friday saw its Gross Domestic Product fall from 3% to 1.4% and both the manufacturing and services PMI read lower than expectations. Both the PMI indexes were higher than the 50.00 level, meaning economists continue to believe the economy will continue to grow. However, the lower reading is a clear indication of strain, particularly when pairing the release with the poor GDP figures. Furthermore, the Core PCE Price Index rose from 0.2% to 0.4%, significantly higher than expectations. For this reason, the Federal Reserve will find it difficult to adjust interest rates, but at the same time this will strain the economy. For this reason, investors continue to increase their exposure to Gold and other safe-haven assets. President Trump’s 2026 State of the Union speech will take place at 02:00 tomorrow morning and can also trigger volatility. Economists will be closely monitoring for comments on policy and trade. US Trade Tariffs Another key driver of gold prices is the Supreme Court’s decision on trade tariffs and the US response. The US Supreme Court ruled that prior tariffs exceeded the administration’s legal authority. The decision limited the executive branch’s power to impose broad trade restrictions without clearer congressional approval. The ruling created market uncertainty, as investors expected the tariffs to remain and support ongoing trade negotiations. In response, the White House signaled it would pursue alternative legal pathways to impose new global tariffs, citing different statutory authorities related to national security or trade imbalances. The US has announced a new 10% tariff, which is now in place. This move has heightened trade tensions with key US partners and introduced renewed volatility across equities, currencies, and commodities. Markets tend to react negatively to abrupt policy shifts, particularly those that raise the risk of retaliatory measures, higher input costs for US companies, and slower global growth. US-Iran Conflict Imminent? US officials are weighing a possible airstrike against Iran tied to nuclear and regional security concerns, with President Trump consulting top advisers amid stalled negotiations, and Iran warning of significant retaliation if attacked. News agencies have very clearly reported the build up of navy and air force in the region which indicates an attack. However, there has not been a build-up of ground forces, which is key. The US State Department ordered nonessential diplomats and families to leave the US Embassy in Beirut, Lebanon, citing heightened threats linked to Iran and its proxies and signaling concern over potential escalation. Gold - Technical Analysis Over the past week, Gold has been forming clear wave highs and obtaining indications of buyers maintaining control. The price during this morning’s Asian session has formed a retracement. However, the retracement has momentum and did not fall to the previous low. As a result, price action continues to remain positive for now. HFM - XAUUSD 1-Hour Chart The price currently remains above the key moving average on both the two and one hour timeframes. In addition, the price remains on the positive side of the RSI. On smaller timeframes, such as the five-Minute chart, the price is forming a symmetrical triangle pattern which is a neutral signal. However, in order to obtain bullish indications, a price above $5,192 would be key. At this level the price will trade above the VWAP, 200-bar moving average and show signs of bullish momentum. Key Takeaways: Gold rebounds strongly: Prices reached February highs after a sharp late-January decline and 71% correction. Macro uncertainty grows: Sticky inflation, weaker GDP, and softer PMIs complicate Federal Reserve policy decisions. Tariff risks rise: A new 10% US tariff increases trade tensions and market volatility. Geopolitical tensions build: Possible US action against Iran boosts safe-haven demand. Always trade with strict risk management. Your capital is the single most important aspect of your trading business. Please note that times displayed based on local time zone and are from time of writing this report. Click HERE to access the full HFM Economic calendar. Want to learn to trade and analyse the markets? Join our webinars and get analysis and trading ideas combined with better understanding of how markets work. Click HERE to register for FREE! Click HERE to READ more Market news. Michalis Efthymiou HFMarkets Disclaimer: This material is provided as a general marketing communication for information purposes only and does not constitute an independent investment research. Nothing in this communication contains, or should be considered as containing, an investment advice or an investment recommendation or a solicitation for the purpose of buying or selling of any financial instrument. All information provided is gathered from reputable sources and any information containing an indication of past performance is not a guarantee or reliable indicator of future performance. Users acknowledge that any investment in Leveraged Products is characterized by a certain degree of uncertainty and that any investment of this nature involves a high level of risk for which the users are solely responsible and liable. We assume no liability for any loss arising from any investment made based on the information provided in this communication. This communication must not be reproduced or further distributed without our prior written permission. -
Can you recommend a better site?
-
 LoneBladeRGC reacted to a post in a topic:
StochRSI Pro
LoneBladeRGC reacted to a post in a topic:
StochRSI Pro
-

roboforex Market Fundamental Analysis by RoboForex
RBFX Support replied to RBFX Support's topic in Fundamental Analysis
Brent: buyers are building momentum ahead of new price surge Brent crude prices continue to rise amid sustained technical strength and escalating geopolitical tensions, currently trading at 71.50 USD. Discover more in our analysis for 24 February 2026. Brent forecast: key takeaways Investors are pricing in the likelihood of negative scenarios and increasing defensive positions Prices are rising on expectations of escalating risks rather than actual supply disruptions Further movement will depend on news from the US and Iran and overall geopolitical rhetoric Fundamental analysis Brent quotes have strengthened for the second consecutive session, although buyers continue to face strong resistance around 71.65 USD. While attempts to consolidate above this level have so far been unsuccessful, the technical outlook remains bullish. Previously, buyers broke above a Triangle pattern, maintaining the potential for further upward movement. Geopolitics is currently the key market driver. Prices are rising mainly on expectations of escalating risks rather than actual supply reductions. Market participants are proactively pricing in negative scenarios and increasing defensive positions. RoboForex Market Analysis & Forex Forecasts Attention! Forecasts presented in this section only reflect the author’s private opinion and should not be considered as guidance for trading. RoboForex bears no responsibility for trading results based on trading recommendations described in these analytical reviews. Sincerely, The RoboForex Team -
Market Technical Analysis by RoboForex
RBFX Support replied to RBFX Support's topic in Technical Analysis
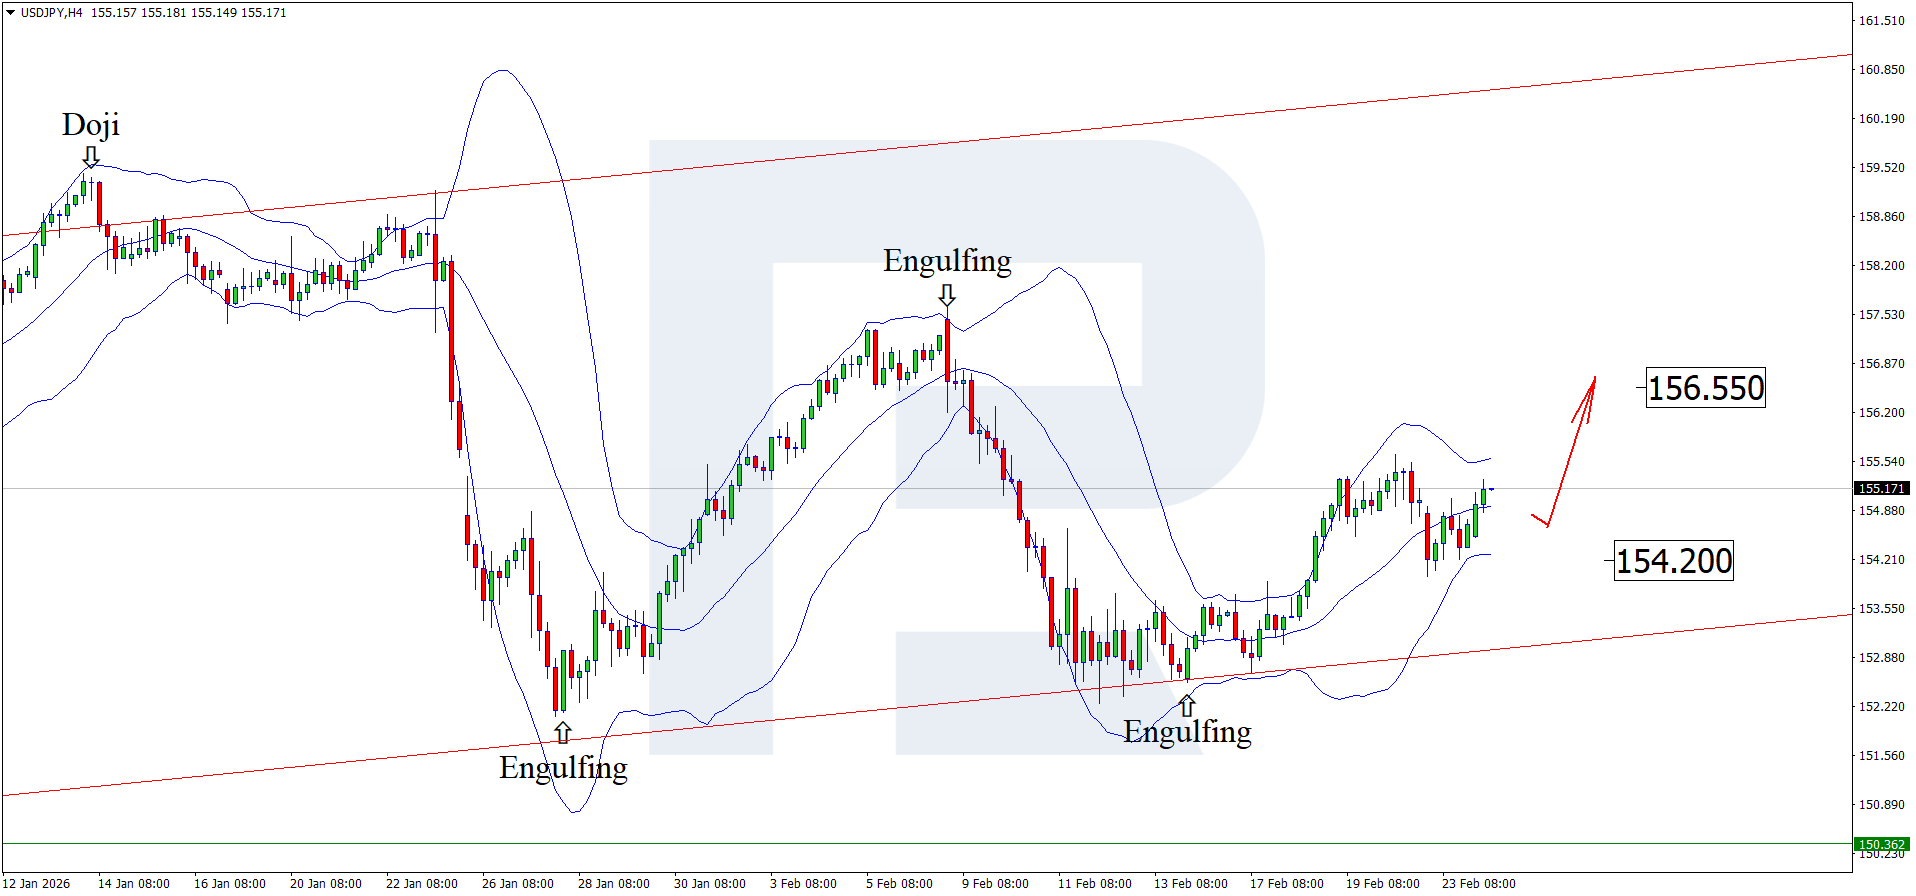
USDJPY on the way to new highs The USD continues to strengthen against the yen amid stabilising US inflation, with the USDJPY pair trading around 155.00. Find out more in our analysis for 24 February 2026. Technical outlook On the H4 chart, the USDJPY pair has formed an Engulfing reversal pattern near the lower Bollinger Band and is trading around 155.00. At this stage, the pair may continue its upward momentum as the pattern plays out, with the next target at 156.55. The yen continues to lose ground amid accommodative monetary policy from the BoJ. Read more - USDJPY Forecast Attention! Forecasts presented in this section only reflect the author’s private opinion and should not be considered as guidance for trading. RoboForex bears no responsibility for trading results based on trading recommendations described in these analytical reviews. Sincerely, The RoboForex Team
-

TDU footprint v.2.0.14 zip + Big trades v1.0.0.9 - new features
Kirua replied to sarutobi's topic in Ninja Trader 8
Someone can post the right version with no error ? -
Ninja_On_The_Roof reacted to a post in a topic:
StochRSI Pro
-
I hear you well. Whatever rocks your boat!😂
-
 Predict joined the community
 -
 check if this helps https://workupload.com/file/sJVfMBxS4gV
 -
tradewithraja bot last version needs to educate,
⭐ ajeet replied to TRADER's topic in Ninja Trader 8
Are you looking for this? https://workupload.com/file/vfvErx3vFUu -
You aren't wrong brother but I love the signal from Stoch ninza indy (looks very pretty and is my type ;)) I have an unique way to use stoch and would love to share this strat here once I have it.
-
 I feel that the sonarlike indy is very underrated. Liked you post brother.
 -
 Could someone reupload these files please : Sonarlike Iceberg Finder Order Flow Presentation v2 thank you in advance !
 -
Can U re-upload Tradeguider,thx! @弗莱盖1
-
Taking risks can create opportunities, but reckless risk destroys capital. In markets, winners take calculated risks based on research, clear goals, and defined downside. Smart risk means sizing positions, using stop losses, diversifying, and accepting small losses to protect long-term growth. Patience and discipline turn risk into opportunity, while emotion and haste turn it into regret. The goal isn’t to avoid risk, but to manage it so you can stay in the game.
-
Crypto mining involves validating transactions and securing a blockchain using computing power. Start by choosing a mineable coin, then pick suitable hardware such as GPUs or ASICs. Install mining software, join a mining pool to smooth rewards, and set up a secure wallet for payouts. Calculate electricity and cooling costs, since they affect profitability. Keep systems updated, monitor performance, and follow local regulations to avoid compliance issues.
-
 As Bitcoin’s dominance increases during market rallies, investors often park capital in the most liquid and trusted asset first, signaling cautious optimism. This trend can help steady the broader market before funds gradually rotate into select altcoins. For diversification, some participants also watch emerging utility-focused projects like LMGX token, which aim to build practical use cases alongside community growth. Keeping a balanced mix of core assets and selective innovation helps manage risk.
 -
If you watch it closely, then you see, the signals mostly fire at the exact Squeeze point of the VWAP. Once in awhile, not. So, what's the point of having the Stoch indicator anyway, since you already know, the signals are at the anchored points of VWAP.🤗