⤴️-Paid Ad- Check advertising disclaimer here. Add your banner here.🔥
All Activity
- Past hour
-
Thanks @kimsam. Anyone able to see all indi available "in list". for me its not showing most of indicators. Also no bar / output with available ones.
-
 ⭐ osijek1289 reacted to a post in a topic:
fixed : DeepStack!Confluence
⭐ osijek1289 reacted to a post in a topic:
fixed : DeepStack!Confluence
-
Good afternoon, what's the password? Thank you.
-
⭐ osijek1289 reacted to a post in a topic:
fixed : VolumeAi
-
fxtrader99 reacted to a post in a topic:
fixed : DeepStack!Confluence
-
fxtrader99 reacted to a post in a topic:
fixed : VolumeAi
-
⭐ ralph kabota reacted to a post in a topic:
fixed : VolumeAi
-
⭐ ralph kabota reacted to a post in a topic:
fixed : DeepStack!Confluence
-
 FCScalper reacted to a post in a topic:
fixed : VolumeAi
FCScalper reacted to a post in a topic:
fixed : VolumeAi
-
Kimsam We all thank you so much. Traderbeauty- Jane
-
Great work
-
FCScalper reacted to a post in a topic:
fixed : DeepStack!Confluence
-
Traderbeauty reacted to a post in a topic:
fixed : VolumeAi
-
Thank you so much Kimsam So good to see you back. Traderbeauty Jane
-
FCScalper reacted to a post in a topic:
fixed : VolumeAi
-
The man, the legend. Super thanks for the work you always provide. 🙏
- Today
-
Thank you very much @kimsam
-
https://workupload.com/file/shbp8teS4A2
-
https://workupload.com/file/a4CzuZD4swd
-
Its keep asking for license
-
NQ 1 Minute May_19_2026 (1).xml
-
The original version posted did work fine.
-
Can anyone post any version that is working? I was able to load a version but the livewire. Blue/Yellow line is not showing up.
-
bluewavetrading
-

Market Technical Analysis by RoboForex
RBFX Support replied to RBFX Support's topic in Technical Analysis
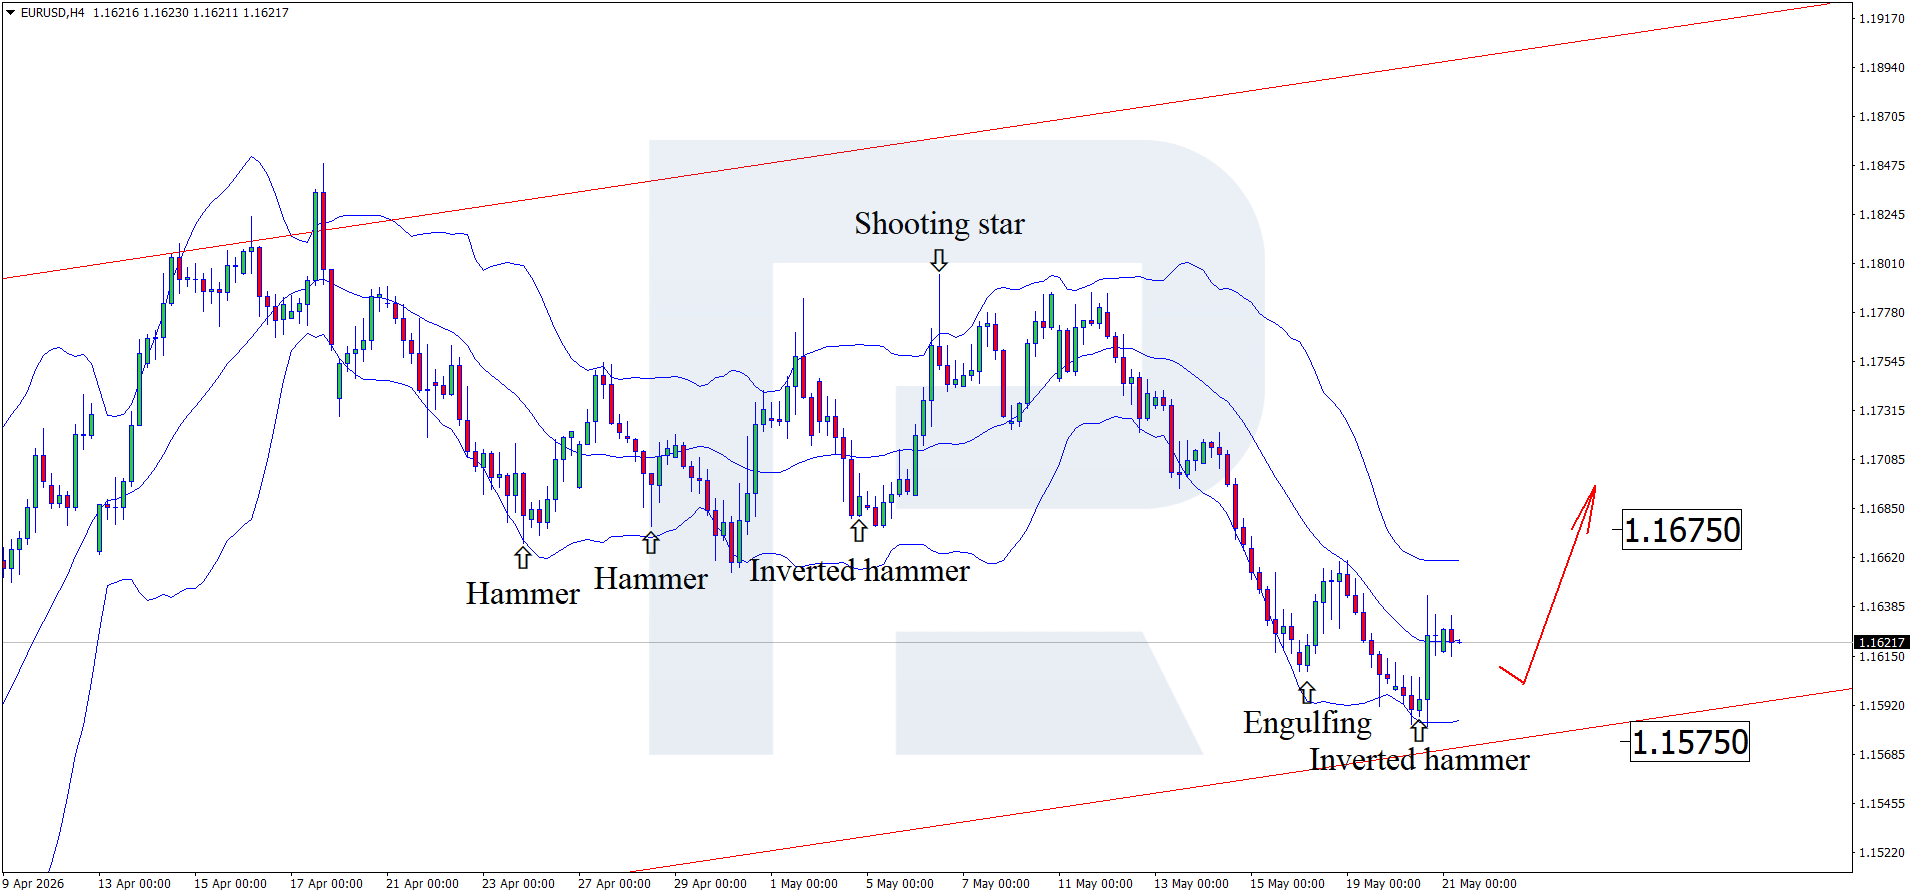
The White House and the Middle East are deciding the fate of EURUSD Following the US President’s statements, the euro strengthened its position, with the rate currently standing at 1.1620. Find out more in our analysis for 21 May 2026. Technical outlook On the H4 chart, the EURUSD pair formed an Inverted Hammer reversal pattern near the lower Bollinger Band. At this stage, quotes may continue their upward trajectory as the signal plays out. Since they remain within an ascending channel, the 1.1675 resistance level may act as the upside target. The euro has every chance of strengthening after statements from the White House. Read more - EURUSD Forecast Attention! Forecasts presented in this section only reflect the author’s private opinion and should not be considered as guidance for trading. RoboForex bears no responsibility for trading results based on trading recommendations described in these analytical reviews. Sincerely, The RoboForex Team
-
roboforex Market Fundamental Analysis by RoboForex
RBFX Support replied to RBFX Support's topic in Fundamental Analysis
JP 225 forecast: the index enters a downtrend The JP 225 stock index broke below the support level and entered a downtrend. The JP 225 forecast for today is negative. JP 225 forecast: key takeaways Recent data: Japan’s Q1 GDP rose by 0.5% Market impact: the effect on the Japanese stock market is moderately positive Fundamental analysis Japan’s GDP growth of 0.5%, above the forecast of 0.4% and the previous 0.2%, is, overall, a moderately positive signal for the JP 225. The data indicates that Japan’s economy is expanding faster than expected, meaning corporate revenue, domestic demand, and business activity may receive additional support. For the JP 225, such data could become a growth driver, since stronger-than-expected macroeconomic releases typically improve investor sentiment towards cyclical stocks. However, the market reaction may be mixed. RoboForex Market Analysis & Forex Forecasts Attention! Forecasts presented in this section only reflect the author’s private opinion and should not be considered as guidance for trading. RoboForex bears no responsibility for trading results based on trading recommendations described in these analytical reviews. Sincerely, The RoboForex Team -

HFMarkets (hfm.com): Market analysis services.
AllForexnews replied to AllForexnews's topic in Fundamental Analysis
Date: 21st May 2026. Strong NVIDIA Earnings: Why the Weak Reaction? NVIDIA’s quarterly earnings report continues to deliver very strong results and guidance for the upcoming quarter, though the stock’s reaction was relatively weak in the short term. At times during the hours after NVIDIA’s report was made public, the stock rose, but at the moment it is trading 1.25% higher. Economists argue that investors had already priced in a strong quarter and did not find the results surprising. In addition, the stock has already gained 70% over the past 12 months, suggesting traders are satisfied with both the gains and the current price. For this reason, the reaction remains relatively muted, although it supports the broader stock market. The NASDAQ and US stock market are seeing both up and down price movement during this morning’s Asian session. This is partially due to traders waiting for the US market to open in order to digest the NVIDIA news, as well as the tug-of-war between positive earnings and geopolitical issues. The NASDAQ Reacts to NVIDIA’s Strong Earnings Report Over the past week, the NASDAQ formed a clear double bottom pattern, followed by a reversed head and shoulders pattern. Both patterns indicate upward price movement due to the index finding support. The key drivers will remain NVIDIA’s earnings report, as well as factors forming due to the US-Iran conflict. In regards to NVIDIA, the main story is still AI infrastructure demand. Earnings per share were $1.87 and revenue was just over $81 billion, both higher than expectations. Data Centre revenue now represents the overwhelming majority of NVIDIA’s business, driven by demand for AI chips, networking, and full-stack AI systems. NVIDIA also reported record Data Center compute revenue of $60.4 billion and networking revenue of $14.8 billion, showing that growth is not only from GPUs but also from the broader AI infrastructure ecosystem. In addition to this, investors are closely monitoring developments within the Middle East. Even though some reports suggest that the negotiations are close to producing a memorandum, the US President and Iran remain in a war of words. This morning, both the US Dollar and crude oil are trading higher due to this. Any escalation causing higher inflation and a further bond selloff can pressure the NASDAQ’s trend. HFM - NASDAQ 15-Minute Chart In the short term, if the price falls below $29,178.40, sell signals are likely to arise. However, if the price rises above $29,288.20, buy signals can strengthen further. All global indices are trading lower this morning, giving a slight bearish bias. However, markets will monitor the price action as the US session opens. Gold Remains Under Pressure from the Dollar And Iran Conflict The price of Gold continues to come under pressure from bond yields, the US Dollar, and global monetary policy. These three elements are tied to the conflict in the Middle East. US President Donald Trump again demanded Iran’s compliance with White House conditions. However, Iran continues to insist on sanctions relief and access to frozen assets before negotiations continue. According to Al Arabiya, US and Iranian representatives may meet in Islamabad after the Hajj season, with this year’s main rituals falling on May 25-29. Mediators from Qatar, Saudi Arabia, Turkey, and Egypt have recently worked to bridge the gaps. Iran now needs to offer specific nuclear commitments, while the US must clarify the process for unblocking Iranian funds. HFM - XAUUSD 1-Hour Chart On the 1-hour chart, the price of Gold continues to trade below the key moving averages and below the VWAP. However, the price remains within the neutral level of the RSI and the MACD. For this reason, Gold is not experiencing sell signals from all indicators, but is seeing a bearish bias. Key Takeaways: NVIDIA delivered strong earnings and guidance, but the reaction remains weak because investors had already priced in a strong quarter. AI infrastructure remains NVIDIA’s main growth driver, with Data Centre revenue now representing the majority of the business. The NASDAQ remains sensitive to both NVIDIA’s performance and geopolitical risks, especially developments in the US-Iran conflict. Gold remains under pressure from a stronger US Dollar, higher bond yields, and uncertainty around global monetary policy. Always trade with strict risk management. Your capital is the single most important aspect of your trading business. Please note that times displayed based on local time zone and are from time of writing this report. Click HERE to access the full HFM Economic calendar. Want to learn to trade and analyse the markets? Join our webinars and get analysis and trading ideas combined with better understanding of how markets work. Click HERE to register for FREE! Click HERE to READ more Market news. Michalis Efthymiou HFMarkets Disclaimer: This material is provided as a general marketing communication for information purposes only and does not constitute an independent investment research. Nothing in this communication contains, or should be considered as containing, an investment advice or an investment recommendation or a solicitation for the purpose of buying or selling of any financial instrument. All information provided is gathered from reputable sources and any information containing an indication of past performance is not a guarantee or reliable indicator of future performance. Users acknowledge that any investment in Leveraged Products is characterized by a certain degree of uncertainty and that any investment of this nature involves a high level of risk for which the users are solely responsible and liable. We assume no liability for any loss arising from any investment made based on the information provided in this communication. This communication must not be reproduced or further distributed without our prior written permission. -
@apmoo @kimsam @NT8S any chance you guys could check it ? thank you 🙏
-
As mentioned by rcarlos1947, this is only protected by vendor license mechanism: https://ibb.co/twLtBSBQ I am not sure what glitches but I havent spent time testing it much.
-
@henryspencer66 You probably know that you can download the latest millabotpro directly from their website without registering at https://www.milla.bot/#hero It will be uneducated but does run on fixed NT8, with some slight glitches. Here's the latest: https://workupload.com/file/z2gNNZbyReb
- Yesterday
-
you can evaluate decisions by Qwen-3 here. https://t.me/passion_trades (Don't go by timing mentioned in message, just follow time of message)
-
Introducing BARFI: My Fully Automated, Multimodal AI Trading System for XAUUSD (Qwen 2.5/3 + Gemini 3.1 + NT8/MT5) Hey everyone, I wanted to share a project I've been building and backtesting over the last few months. It's now fully automated from market analysis to trade execution. I call it BARFI (Bullion Analytics Research & Forecasting Intelligence). The core goal of BARFI is to solve a massive problem in algorithmic trading: combining raw data (OHLCV) with visual context (Footprint/Order Flow charts) to understand market regimes. Here is exactly how the architecture works, from ingestion to execution. 1. The Data Foundation & Local FineTuning Before automating live data, I built a heavy training dataset to teach a local Small Language Model (SLM) what specific market regimes look like: The Dataset: 1,000+ intraday 5-minute order flow footprint charts and over 1 million rows of historical OHLCV data in CSV format. The Local Brain: I used this data to train/finetune an open source Qwen 2.5 model. Its sole job is pattern matching n recognizing current market regimes by matching live setups against my historical database. 2. The Hourly Ingestion Pipeline Every hour, on the hour, a dual platform bridge triggers: NinjaTrader 8 (NT8): Automatically takes and saves a screenshot of the live 5-minute footprint/order flow chart. MetaTrader 5 (MT5): Automatically exports the last 500 rows of 5min OHLCV data. 3. Layer 1: Local Screening (The SLM) Instead of throwing raw data blindly at an expensive cloud API, BARFI uses the local finetuned Qwen 2.5 model first. The local SLM ingests the new hourly data. It scans the historical database to find the 5 most mathematically and visually matched historical scenarios. It compiles these 5 scenarios into an initial structured analysis report. 4. Layer 2: Deep Reasoning (Qwen 3-Max-Thinking) Once the local report is ready, BARFI calls the Qwen 3-Max-Thinking API. This layer handles the heavy cognitive lifting. Inputs sent: The live 5-minute footprint screenshot + the 500 rows of OHLCV data + the local SLM’s 5 scenario matching report. The Output: Qwen 3-Max conducts an in-depth reasoning analysis, predicts the trend for the upcoming 1 hour, and establishes exact, decisive price levels (Support, Resistance, Invalidation). 5. Layer 3: Agentic Execution & Management (Gemini 3.1 Flash Lite) Once Qwen 3-Max outputs the trend and levels, an agentic AI workflow takes over utilizing Gemini 3.1 Flash Lite for fast, low-latency execution: Broadcast: It formats the trend and levels and instantly sends a broadcast to a private Telegram channel via API. Execution: It parses the decisive levels, calculates risk management metrics (position sizing, risk/reward ratio), and triggers a live trade directly into MT5. Trade Management: Gemini doesn't just "fire and forget." The agent stays active, watching the trade in real-time on MT5 until either the Target Profit or Stop Loss is met. Why This Hybrid Approach Works What I love most about this setup is the efficiency vs. capability balance. Running everything through a massive thinking model every hour is slow and expensive. By utilizing a highly specialized, locally trained model to do the initial "heavy lifting" filter, the cloud model only has to reason across highly curated, relevant data. So far, the multimodal approach (giving the AI both the visual footprint chart and the hard numbers of the OHLCV) has vastly outperformed my old numbers, only models, especially on XAUUSD where volume profile and order flow shifts dictate the intraday trend. Would love to hear your thoughts on this multi model architecture!
-
That’s a solid take. If you’re the kind of trader who likes to get hands on with order flow, ATAS really shines. The built-in footprint charts are sharp, and the default settings just work, plus the free tier is hard to pass up. But let’s be real,these platforms are built so differently when you look at where you want your trading to go in the long run. ATAS is basically a great visual toolkit. On the other hand, NinjaTrader 8 feels more like a playground for developers. Since NT8 hooks right into C# and the .NET library, you can create automated workflows and analysis tools that ATAS just isn’t built to handle. With NT8, you’re not stuck drawing indicators and staring at charts. You can actually write custom scripts to do things like connect your trading setup to Python or AI models, snag chart data automatically, crunch numbers behind the scenes, and feed those results back into your trading system, Or throw together multilayered trading bots that hunt for opportunities across tons of instruments at the same time,all running your own logic. So, yeah,ATAS works wonders if you want to act fast and make manual decisions. But if you’re aiming to scale up and automate, or tap into the latest AI analysis, NT8’s open-source flexibility is a game changer. Good luck on the switch. In the end, it’s just about finding the right tool for how you like to trade.