⤴️-Paid Ad- Check advertising disclaimer here. Add your banner here.🔥
All Activity
- Today
-

roboforex Market Fundamental Analysis by RoboForex
RBFX Support replied to RBFX Support's topic in Fundamental Analysis
Inflation weighs on gold: XAUUSD could fall below 4,000 again Rising government bond yields are making dollar-denominated assets more attractive than gold, which does not generate interest income. Prices currently stand at 4,059 USD. XAUUSD forecast: key takeaways The Consumer Price Index (CPI) rose by 0.4% month-on-month, above expectations of 0.3%, while the core CPI increased by 0.3% against a forecast of 0.2% The probability of a Federal Reserve interest rate hike in December rose to around 90% XAUUSD forecast for 11 November 2026: 3,800 Fundamental analysis Gold prices came under significant pressure following the release of US macroeconomic data. The key event was the publication of October consumer inflation figures. The CPI rose by 0.4% month-on-month, exceeding expectations of 0.3%, while core CPI increased by 0.3% against a forecast of 0.2%. Changing expectations for the Federal Reserve's future monetary policy are putting additional pressure on the precious metal. RoboForex Market Analysis & Forex Forecasts Attention! Forecasts presented in this section only reflect the author’s private opinion and should not be considered as guidance for trading. RoboForex bears no responsibility for trading results based on trading recommendations described in these analytical reviews. Sincerely, The RoboForex Team -
Market Technical Analysis by RoboForex
RBFX Support replied to RBFX Support's topic in Technical Analysis
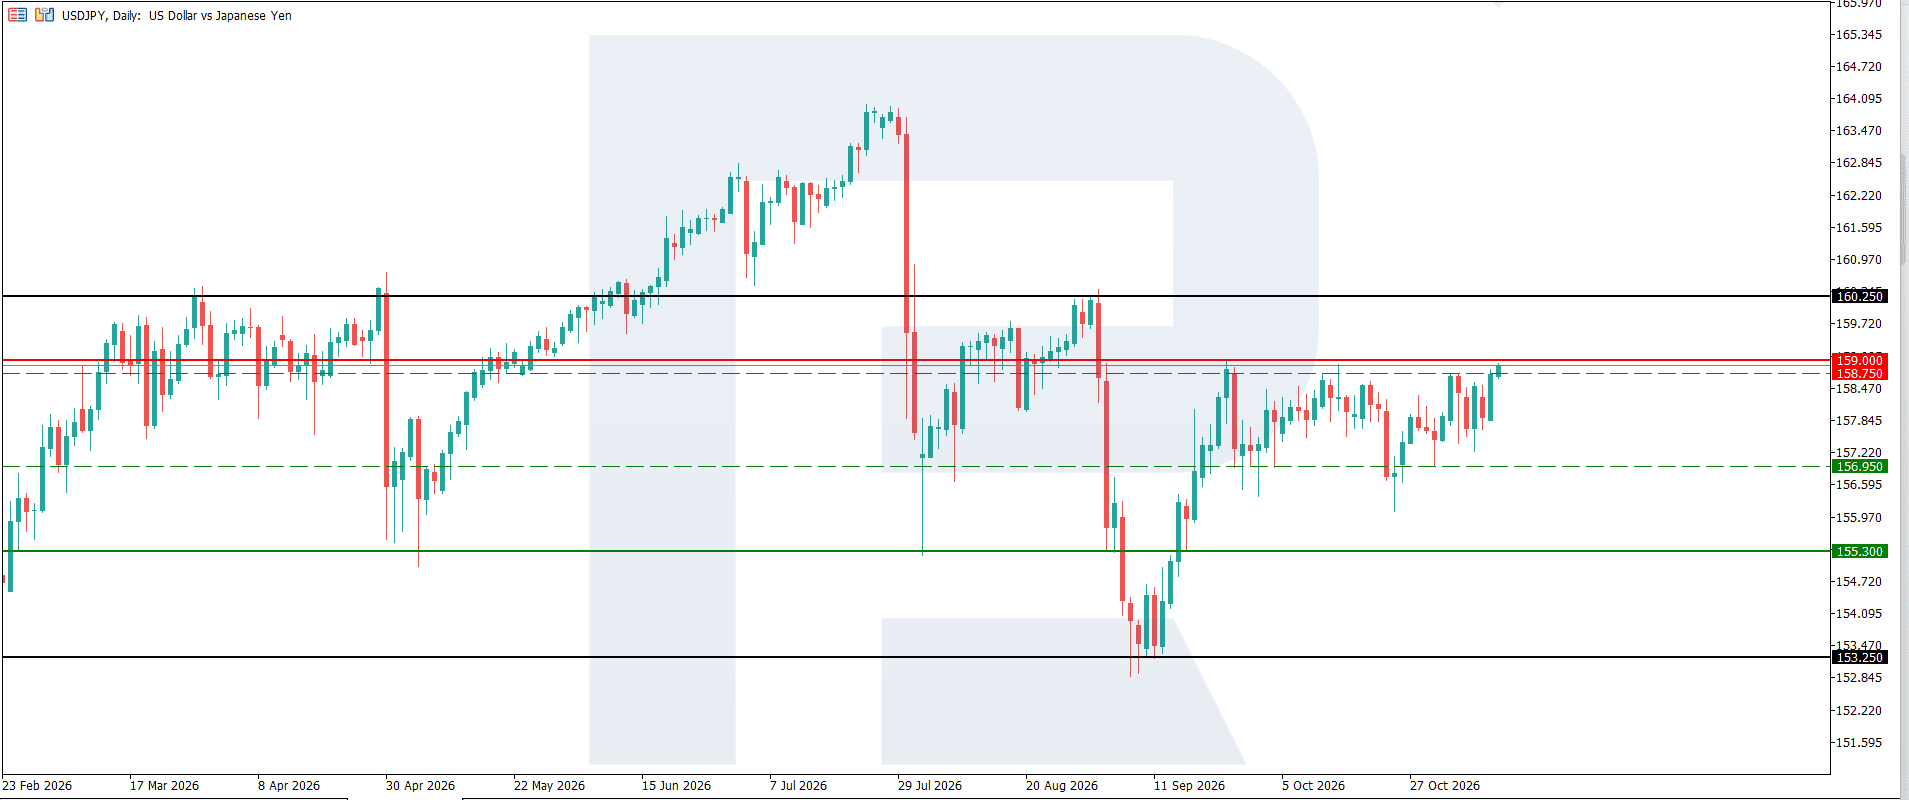
Yen weakness persists: USDJPY tests resistance with a view to breaking above 160.00 The main catalyst for the move was the release of US inflation data, which fuelled expectations of further Federal Reserve monetary policy tightening. The USDJPY rate currently stands at 158.90. Technical outlook On the D1 chart, the USDJPY pair is trading in an uptrend, with a resistance level at 159.00 and a support level at 156.95. On the H4 chart, local resistance has shifted to 158.75, while support lies at 156.95. In the short term, fundamental factors predominantly support further gains in the USDJPY pair. Read more - USDJPY Forecast Attention! Forecasts presented in this section only reflect the author’s private opinion and should not be considered as guidance for trading. RoboForex bears no responsibility for trading results based on trading recommendations described in these analytical reviews. Sincerely, The RoboForex Team
-
 Dont Spam joined the community
-

HFMarkets (hfm.com): Market analysis services.
AllForexnews replied to AllForexnews's topic in Fundamental Analysis
Date: 11th November 2026. Waller’s Warning and Hot Inflation Rattle Markets: Is a 0.50% Hike Coming? The Federal Open Market Committee member, Christopher Waller, rattled markets on Tuesday, while high inflation figures added to investors’ concerns. The US Dollar Index rose 0.70% before retracing, and Gold fell more than 2.50%. The Federal Reserve Governor, Christopher Waller, spoke at the Bank of England’s Watchers’ Conference in London. Mr Waller is known to be one of the more senior members of the committee and sounded considerably more hawkish than markets had priced into monetary policy. Adding to the hawkish tone was the latest Consumer Price Index, which saw inflation rise above expectations. As a result, markets are erasing any possibility of a pause in December and are even considering a larger hike. Speaking at the Bank of England’s Watchers’ Conference, Mr Waller told journalists that if inflation came in as per market expectations, he would vote for a 0.25 percentage point rate hike. At the time, almost 75% of the market was pricing in a quarter-percentage-point rate hike. For this reason, this comment did not create significant volatility. However, as the governor continued, he also stated that if inflation rose above expectations, particularly core CPI figures, he would deem a 0.50 percentage point hike appropriate. At the time, the market was not considering any possibility of a larger rate hike. This comment came as a particular shock to the market. Waller expressed concern about persistent price pressures, particularly across services, energy, and AI-related goods. He described economic growth as healthy and the labour market as stable, giving the Fed room to tighten monetary policy. The Federal Reserve has not adjusted interest rates by 0.50 percentage points in almost four years. According to the Chicago Exchange, the market now deems a 0.25 percentage point hike an 85% possibility and a larger hike as a 15% possibility. The consensus remains for a 0.25 percentage point hike, but the market now believes the Fed will be more hawkish over the next three months. For example, a 0.25 percentage point hike in December with a further hike in January. US inflation rose more than expected in October, increasing concerns about persistent price pressures. This is particularly important as the inflation figures followed the hawkish comments from Christopher Waller. The Consumer Price Index increased by 0.4% month-on-month, exceeding economists’ expectations of 0.3%, although it slowed from September’s 0.6% increase. Core inflation, which excludes food and energy, rose by 0.3%, also exceeding forecasts. Higher housing, food, and energy costs contributed to the increase, with food prices rising 0.5% and energy prices climbing 0.7%. Economists estimate that annual inflation is now at 4.00%, double the target of the Federal Reserve. Demand for the US Dollar increased significantly as investors shifted capital away from bonds, Gold and other assets in favour of the currency. The US Dollar Index also continues to gain during this morning’s Asian session and remains the best-performing currency of the day. HFM - US Dollar Index 4-Hour Chart The USD/JPY is one of the currency pairs which are under considerable pressure, as the interest rate difference between the Fed and Bank of Japan are likely to start widening again. The USD/JPY is showing signs of short-term exhaustion following its recent rally. However, there is no sign of the trend reversing back down towards 158.000. A breakout above 158.920 and 158.940 will significantly strengthen bullish indications. On the daily timeframe, USD/JPY continues to demonstrate a bullish structure, trading above its 20-day and 50-day moving averages. The RSI is near 56, indicating positive momentum without reaching traditional overbought territory. The next significant resistance area lies around 159.00–159.20, followed by the psychological 160.00 level. A key level for the currency pair as the price increases will be the 159.745, which is a key resistance level and the psychological price of 160.000. The price of the Gold was falling throughout all sessions on Tuesday but gained momentum after Mr Waller’s comments and the CPI release. Currently, the indications are no longer pointing towards a downward price movement despite fundamentals turning negative for Gold. Gold on Wednesday has so far risen 0.75%, but remains below the previous day’s average, which was at $4,046.79. The price structure on Wednesday remains stable so far, with Gold rising and forming clear higher highs and higher lows. The price is also trading above all moving averages and above the day’s VWAP. HFM - Gold 1-Hour Chart On the 5-minute timeframe, the only bearish signal is the divergence of most oscillators, which is pointing towards the upward price movement being fragile. This would also be in line with the fundamentals. However, in order for technical indicators and price action to turn bearish, the price must fall below $4,040.00 at a minimum. At this point, the price will break below the 200-period moving average and below key price levels. Fed Governor Christopher Waller signals that a larger 50-basis-point rate hike could be appropriate if inflation remains elevated. October’s CPI rises by 0.4%, above forecasts of 0.3%, increasing concerns about persistent inflationary pressures. Markets now price in an 85% probability of a 0.25% hike and a 15% chance of a larger 50-basis-point hike. The US Dollar Index rises 0.70% while Gold falls more than 2.50%, as investors react to inflation data and expectations of tighter monetary policy. Always trade with strict risk management. Your capital is the single most important aspect of your trading business. Please note that times displayed based on local time zone and are from time of writing this report. Click HERE to access the full HFM Economic calendar. Want to learn to trade and analyse the markets? Join our webinars and get analysis and trading ideas combined with better understanding of how markets work. Click HERE to register for FREE! Click HERE to READ more Market news. Michalis Efthymiou HFMarkets Disclaimer: This material is provided as a general marketing communication for information purposes only and does not constitute an independent investment research. Nothing in this communication contains, or should be considered as containing, an investment advice or an investment recommendation or a solicitation for the purpose of buying or selling of any financial instrument. All information provided is gathered from reputable sources and any information containing an indication of past performance is not a guarantee or reliable indicator of future performance. Users acknowledge that any investment in Leveraged Products is characterized by a certain degree of uncertainty and that any investment of this nature involves a high level of risk for which the users are solely responsible and liable. We assume no liability for any loss arising from any investment made based on the information provided in this communication. This communication must not be reproduced or further distributed without our prior written permission. -
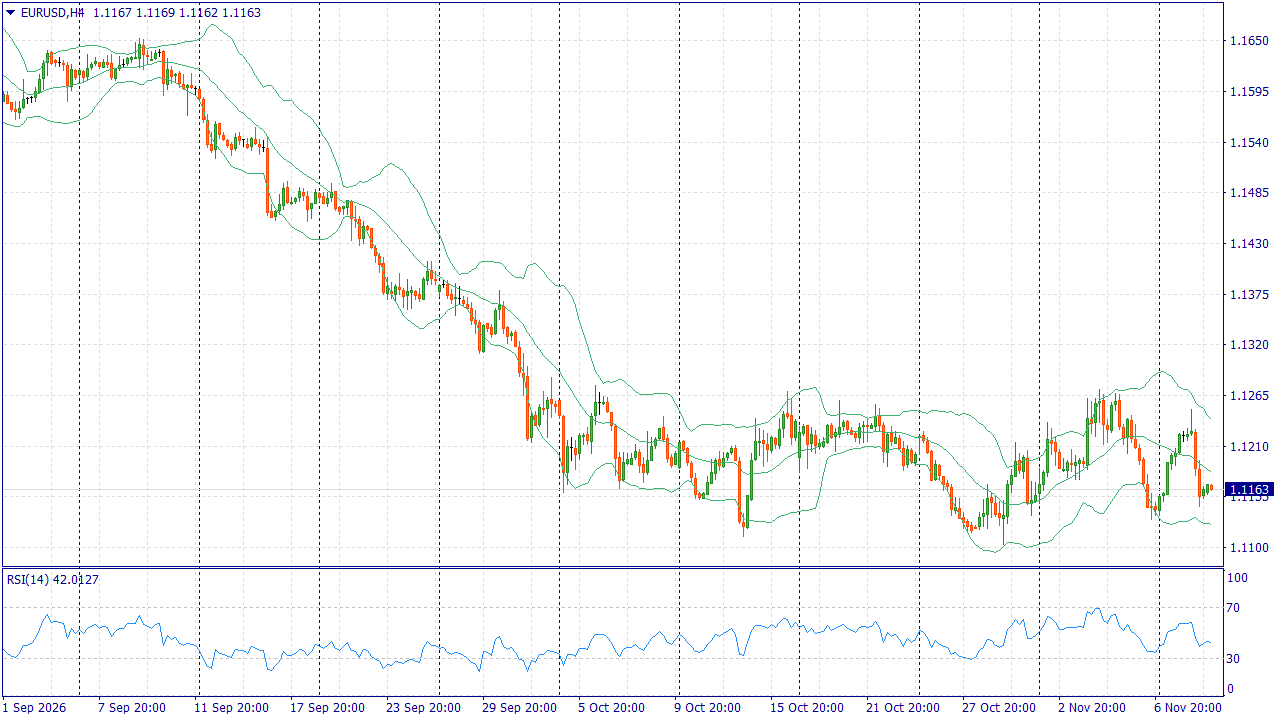
 Fundamental Market Analysis for November 11, 2026 EURUSD EURUSD: The Freshforex birthday celebration continues! To celebrate our 22nd anniversary, we are offering: Swap-free trading until November 15! A 220% drawdown bonus from $220! Double cashback — up to $40 per lot! For the euro, the main counterweight to the strong US dollar remains the ECB's readiness to curb inflation. On Tuesday, Joachim Nagel stated there were solid grounds for raising rates in December. However, Philip Lane linked further decisions to the pass-through of energy costs into wages and other prices. Such signals support the euro but do not imply a pre-agreed acceleration of tightening. American data provided a clearer signal: consumer prices rose by 0.4% month-on-month in October against an expected 0.3%. Christopher Waller also advocated for an FRS rate hike in December. The combination of data and statements strengthened demand for the dollar as investors revised their expectations for borrowing costs in the US. New reasons are now needed to weaken this argument. Part of the US advantage is already reflected in yesterday's pair decline, so extrapolating that magnitude onto Wednesday would be premature. Lower energy costs would support European business, and stronger ECB signals could help the euro recover. While the market revises US rates upward, the base scenario for EURUSD allows for further moderate declines. Trading idea: SELL 1.1165, SL 1.1185, TP 1.1120 FreshForex offers a wonderful bonus 300% on every deposit from $100, providing an opportunity to increase trading volumes! You can find more analytical information on our website.
-

VIP Membership - FREE upgrade for OLD and ACTIVE Members
Sidtrader replied to MrAdmin's topic in Announcements
Please add me to VIP. @Traderbeauty - Yesterday
-

VIP Membership - FREE upgrade for OLD and ACTIVE Members
⭐ maik wills replied to MrAdmin's topic in Announcements
Thank you so much😇 -
roboforex Market Fundamental Analysis by RoboForex
RBFX Support replied to RBFX Support's topic in Fundamental Analysis
EURUSD faces a new test: US inflation could dash hopes of a euro recovery The EURUSD pair is awaiting the release of US inflation data, with the rate currently standing at 1.1226. EURUSD forecast: key takeaways US CPI for October: projected at 3.9%, previously at 3.7% Core inflation is forecast at around 2.8% EURUSD forecast for 10 November 2026: 1.1150 Fundamental analysis The EURUSD forecast takes into account that the euro is attempting to hold its ground amid dollar weakness following the US midterm elections. However, strong US economic data and expectations of further Federal Reserve interest rate hikes are limiting the scope for a euro recovery. The dollar has stabilised ahead of the US inflation release. Following its recent decline, the US currency has entered a consolidation phase. Investors are awaiting October CPI data. RoboForex Market Analysis & Forex Forecasts Attention! Forecasts presented in this section only reflect the author’s private opinion and should not be considered as guidance for trading. RoboForex bears no responsibility for trading results based on trading recommendations described in these analytical reviews. Sincerely, The RoboForex Team -
Market Technical Analysis by RoboForex
RBFX Support replied to RBFX Support's topic in Technical Analysis
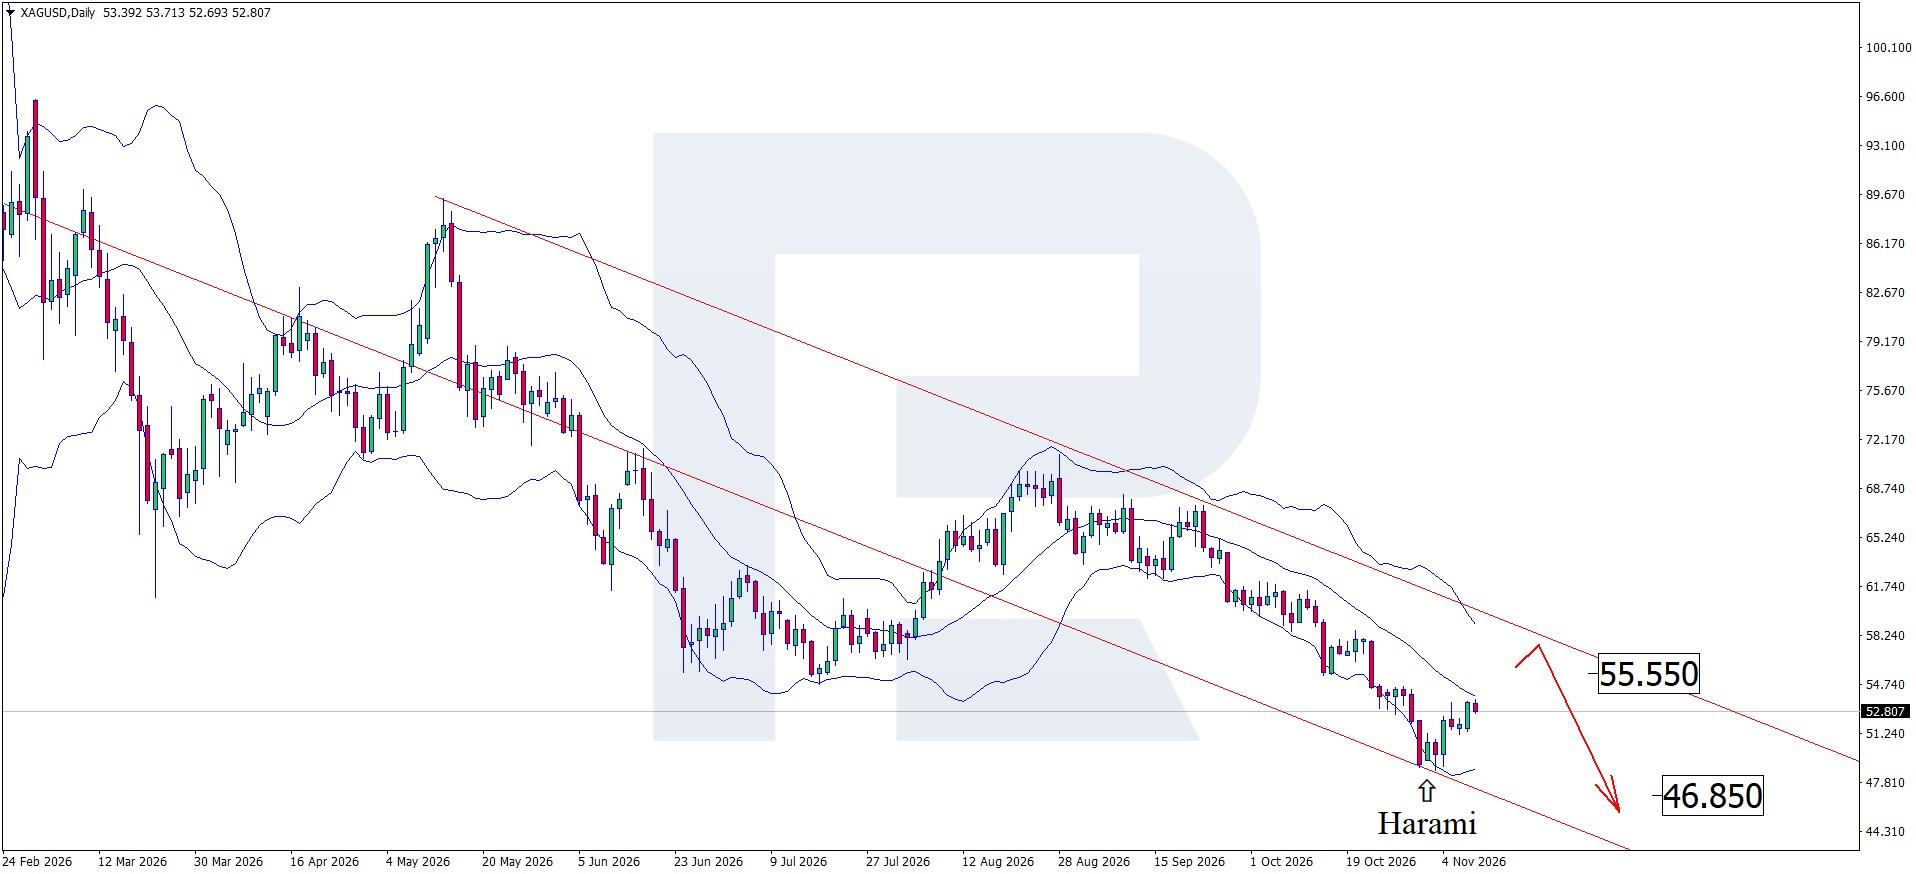
US inflation could deal another blow to XAGUSD: markets pause ahead of the CPI release Silver is still attempting to gain ground as investors await US inflation data, with prices currently hovering at 52.80 USD. Technical outlook On the D1 chart, XAGUSD prices have formed a Harami reversal pattern near the lower Bollinger Band and could extend their corrective wave as the pattern's signal plays out. Since XAGUSD remains within a descending channel, the target for the pullback is the 55.55 USD resistance level. US inflation expectations are preventing silver from strengthening and reversing the existing trend. Read more - Silver Forecast Attention! Forecasts presented in this section only reflect the author’s private opinion and should not be considered as guidance for trading. RoboForex bears no responsibility for trading results based on trading recommendations described in these analytical reviews. Sincerely, The RoboForex Team
-
Welcome to Indo-Investasi.com. Please feel free to browse around and get to know the others. If you have any questions please don't hesitate to ask.
-
HFMarkets (hfm.com): Market analysis services.
AllForexnews replied to AllForexnews's topic in Fundamental Analysis
Date: 10th November 2026. USD Decline Prompts Gold Rebound Ahead of Key CPI Release. The US Dollar Index saw a strong decline on Monday, falling from 102.08 to 101.48, supporting Gold. Gold prices rose to the $4,145.00 resistance level due to the decline in the Dollar and oil prices. However, the primary driver of the week is likely to remain the US Consumer Price Index (inflation rate). Markets expect a moderate increase for October’s inflation figures. The current expectations are that inflation will rise from 3.7% to 3.9%, almost double the Federal Reserve’s target. Over the past week, Gold’s prices have continued to improve after a record decline; however, inflation remains a key concern. NFP and Consumer Price Index Friday’s NFP report showed that the US economy added 165,000 jobs in October, significantly exceeding market expectations of 65,000. This marked a considerable improvement from September’s upwardly revised figure of 60,000 and was the highest figure in five months. Meanwhile, the unemployment rate declined from 4.2% to 4.1%, indicating continued resilience in the US labour market. Average hourly earnings increased by 0.4% month-on-month and 3.1% annually, suggesting that wage pressures remain present. Investors were particularly interested in the strong wage increase, as it is known to contribute to persistent inflation as consumer demand rises. At first, Gold fell moderately by 0.75%, but momentum failed and Gold was quick to rebound on Monday. However, if inflation comes in higher than market expectations, the Federal Reserve may become noticeably more hawkish over the next six months. As a result, Gold may witness renewed pressure, declining back to the $4,000 psychological level. In addition to the inflation rate, investors will also monitor the core Consumer Price Index, which investors expect to rise from 2.6% to 2.7%. The US Dollar Index and Oil Prices One of the key factors supporting Gold’s upward momentum is the weakening US Dollar. The US Dollar is weakening due to the decline in oil prices and easing Middle East tensions. Since Friday’s market close, the US Dollar Index has fallen by 0.68% and is now trading at a five-day low. This morning, Crude oil prices have fallen by a further 6% declining to their lowest level since late August. The decline in oil prices is also a positive factor for inflation and will impact the Fed’s interest rate guidance. This can also be positive for Gold, but in order to have a sustainable impact, oil prices will need to continue declining below $80 as a bare minimum. The lower oil prices fall, the more positive it will be for the Gold prices and the more negative for the US Dollar. However, this will largely depend on whether tensions continue to ease, which remains highly uncertain for now. If oil prices continue to decline further throughout the day, the inflation release may have a lesser impact. Gold (XAU/USD) - Technical Analysis and CPI Release If the US inflation rate and core Consumer Price Index both come in higher than the market’s expectations, the price of Gold may come under pressure and decline. However, traders should remain cautious, as prices could rebound later in the day, particularly if oil prices continue to decline. If the CPI releases come in 0.1% higher than expectations, the release will be deemed negative, but 0.2% higher could be particularly damaging. However, lower inflation could prompt stronger demand. This will also depend on the CPI release and whether the US Dollar Index also continues to remain weak. Gold's four-hour chart currently supports a cautiously bullish outlook, but the daily and weekly trends remain less convincing. The main challenge for buyers is to establish a sustained breakout above $4,150 and subsequently $4,200. On the smaller timeframes, bullish indications are likely to materialise as the price breaks above $4,127.70. HFM - Gold 30-Minute Chart Key Takeaways: Gold approaches $4,150 as the US Dollar and oil prices continue to decline. Markets expect US inflation to rise to 3.9%, potentially increasing pressure on the Federal Reserve. Stronger-than-expected NFP figures highlight continued resilience in the US labour market. A breakout above $4,150 could support further gains towards $4,200, while higher inflation could trigger renewed selling pressure. Always trade with strict risk management. Your capital is the single most important aspect of your trading business. Please note that times displayed based on local time zone and are from time of writing this report. Click HERE to access the full HFM Economic calendar. Want to learn to trade and analyse the markets? Join our webinars and get analysis and trading ideas combined with better understanding of how markets work. Click HERE to register for FREE! Click HERE to READ more Market news. Michalis Efthymiou HFMarkets Disclaimer: This material is provided as a general marketing communication for information purposes only and does not constitute an independent investment research. Nothing in this communication contains, or should be considered as containing, an investment advice or an investment recommendation or a solicitation for the purpose of buying or selling of any financial instrument. All information provided is gathered from reputable sources and any information containing an indication of past performance is not a guarantee or reliable indicator of future performance. Users acknowledge that any investment in Leveraged Products is characterized by a certain degree of uncertainty and that any investment of this nature involves a high level of risk for which the users are solely responsible and liable. We assume no liability for any loss arising from any investment made based on the information provided in this communication. This communication must not be reproduced or further distributed without our prior written permission. -
Brent at $90, WTI below $85. Where could the oil decline stop? On November 10, #BRENT fell to $90.42, and #WTI to $84.68 per barrel. In the previous session, Brent futures lost 5.85%, and WTI lost 4.38%. A new wave of selling began after Donald Trump stated that strikes on Iran are unlikely as long as negotiations are progressing. After meeting with the Prime Minister of Qatar on November 9, the US President confirmed that he currently sees no need to resume strikes. All four targets of our forecast from November 3 were met last week. #BRENT passed $103 and $100, and #WTI passed $95 and $94. Since then, both benchmarks have lost an additional $9+ per barrel. FreshForex's Birthday continues! In honor of our 22nd anniversary, we are giving: Swap-free trading until November 15! 220% drawdown bonus starting from $220! Double cashback — up to $40 per lot! Why oil continued to fall Last week, initial reports of Iran's contacts with Qatari mediators eased concerns about supply disruptions. Now Washington has publicly signaled its readiness to refrain from new strikes. The lower the probability of escalation, the less buyers are willing to pay a premium for the risk of export interruptions. An additional signal came from Iraq. The country's Foreign Minister announced an agreement with the US, which provides for transporting Iraqi oil through the Strait of Hormuz via a route along the coast of Oman. If tankers can regularly use this route, part of the supply will become more predictable. What could bring buyers back Trump stated that the US will maintain the maritime blockade of Iran. Meanwhile, reports continue to emerge from the Strait of Hormuz area regarding attacks on vessels. It is now important for the market whether tankers can pass through the strait regularly. New disruptions could quickly return part of the risk premium to the price. According to analysts FreshForex, the decline may continue if negotiations with Iran progress and flights of Iraqi tankers confirm that the agreement with the US is working. Then buyers will have fewer reasons to pay a premium for the risk of supply disruptions. Under such a scenario, by the end of the week, #BRENT could drop to the $87–88 per barrel range, and #WTI to $82–83. Only 5 days, remain to get 220% Drawdown Bonus upon depositing from $220! Activate the bonus, activate promo code FF22 in your Client Area, and celebrate with us!
-
Welcome to Indo-Investasi.com. Please feel free to browse around and get to know the others. If you have any questions please don't hesitate to ask.
-

How to upgrade to vip member
-
-
 lorenzo_dacatio joined the community
-
raiden2861 joined the community
-
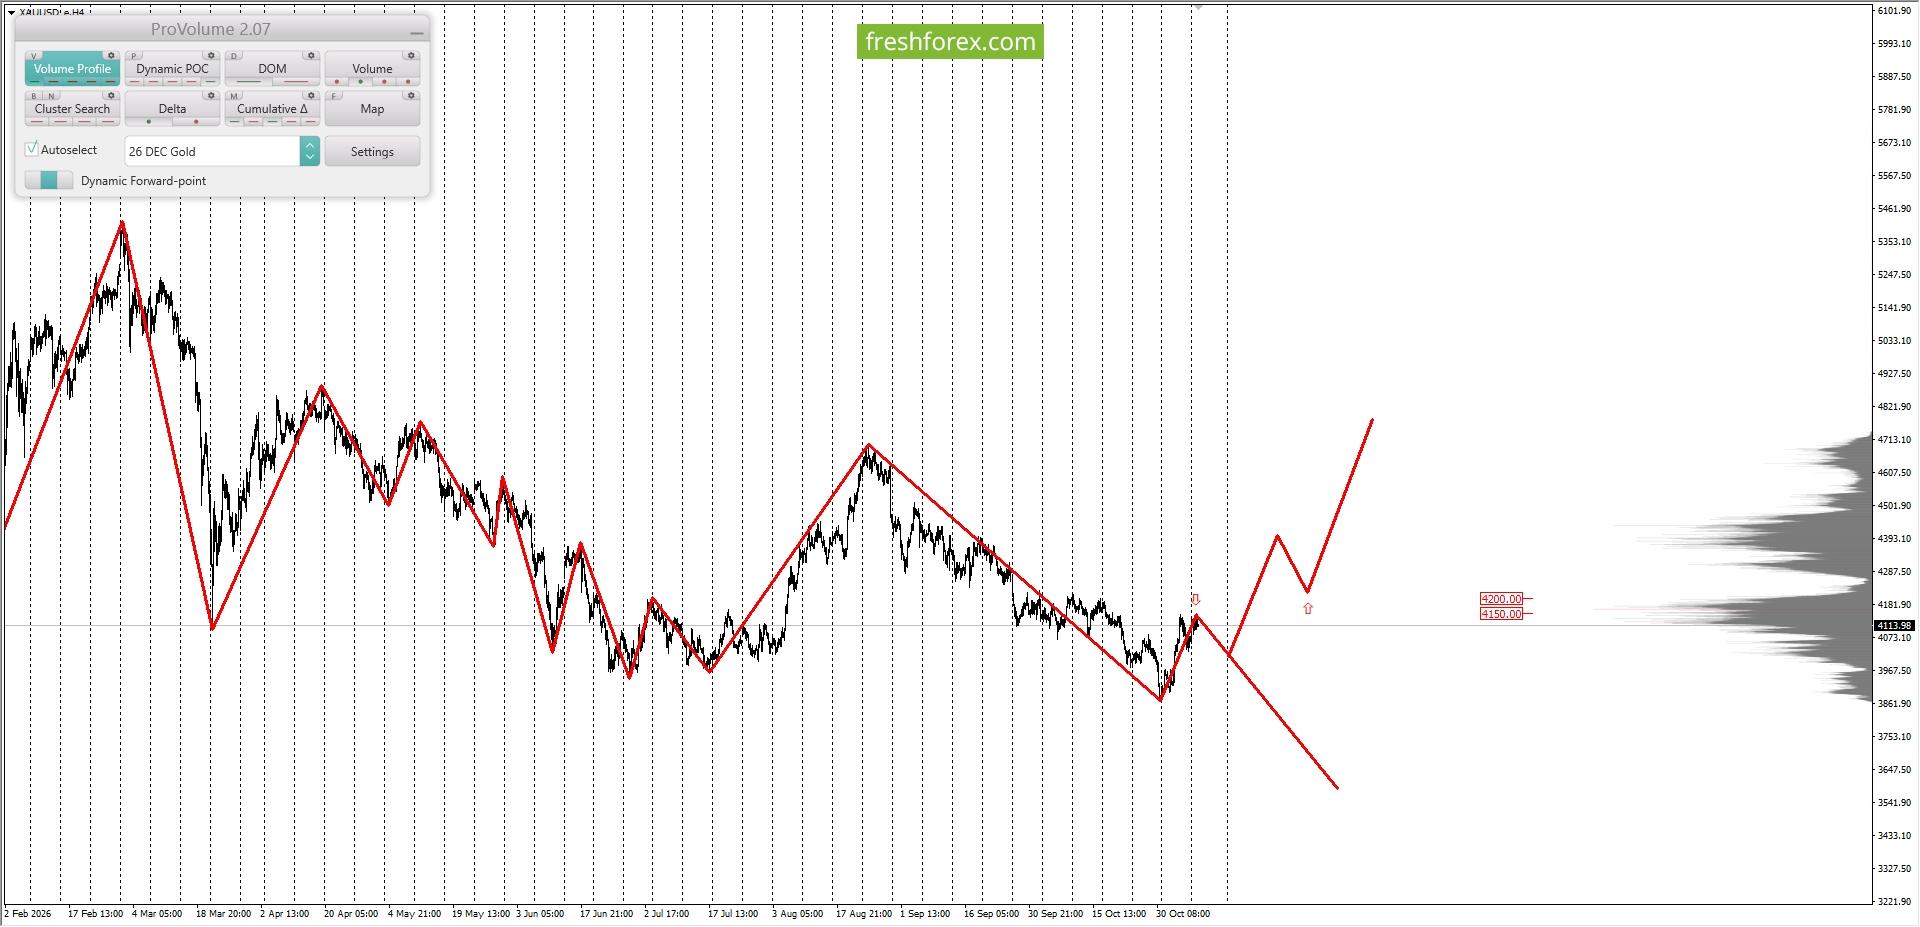
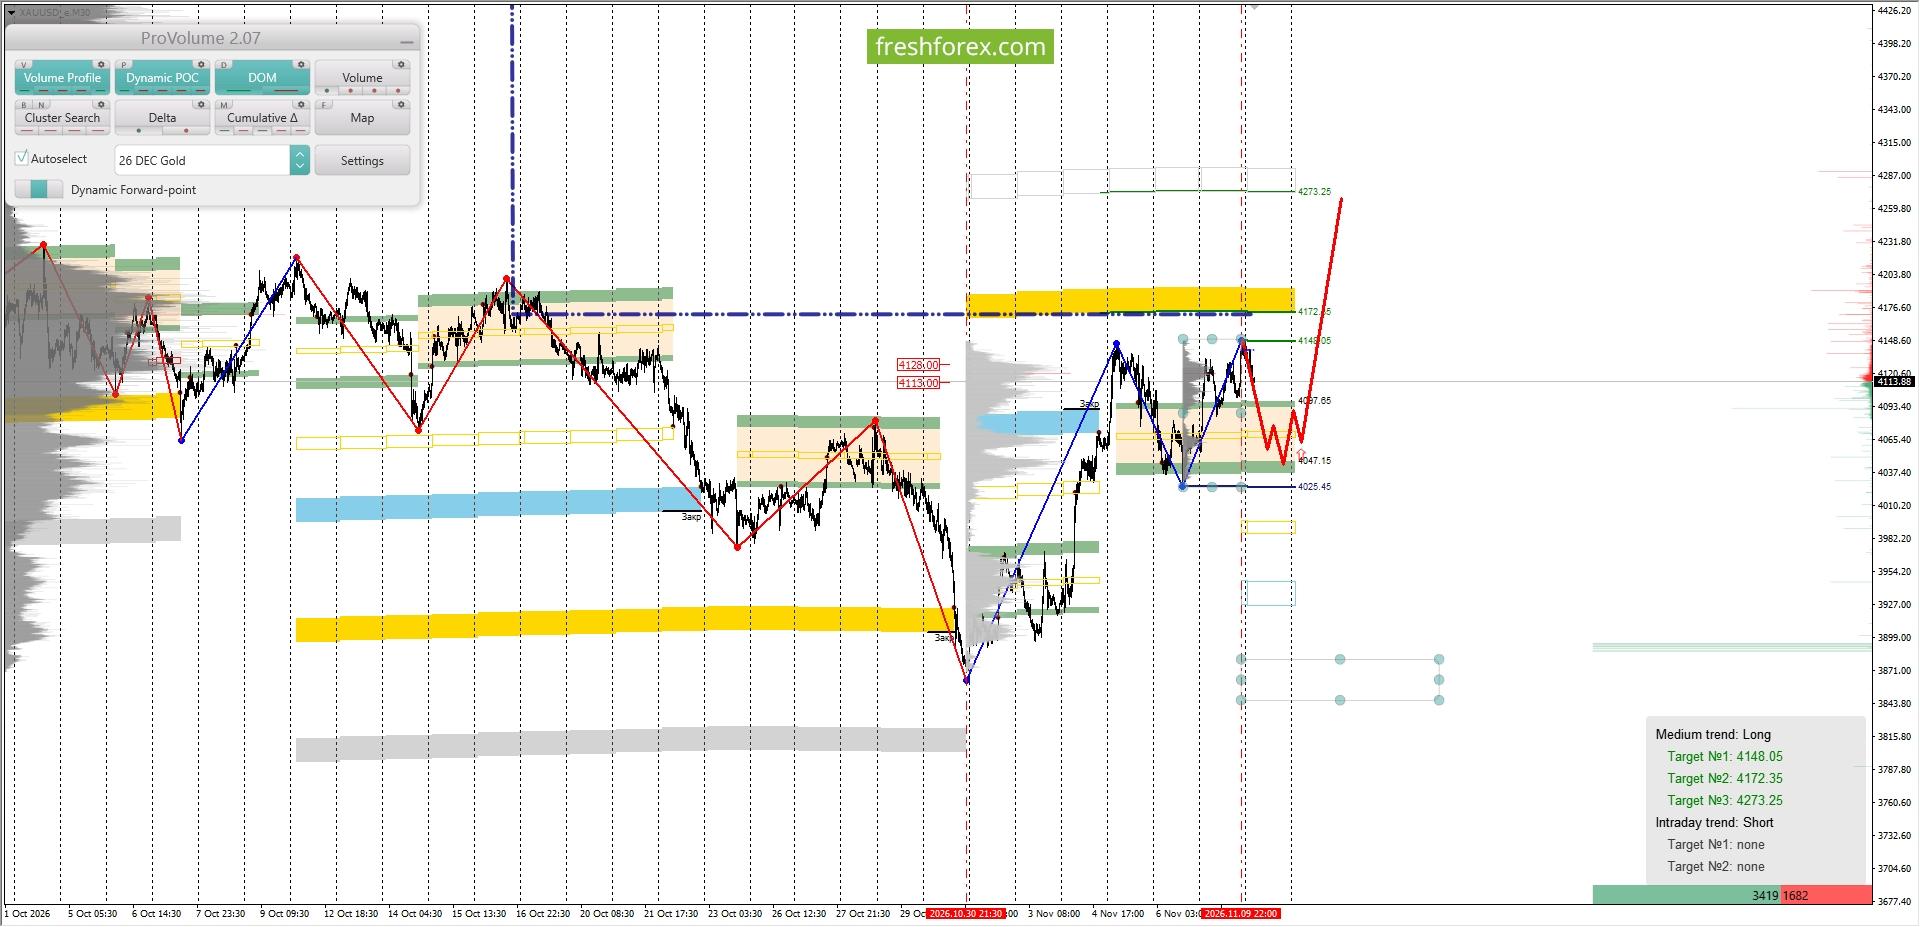
Analysis of margin levels for November 10, 2026 XAUUSD XAUUSD: BUY 4047.15-4097.65, TP1-4148.05, TP2-4273.25. The Freshforex birthday celebration continues! To celebrate our 22nd anniversary, we are offering: Swap-free trading until the end of the month! A 220% drawdown bonus from $220! Double cashback — up to $40 per lot! Long-term trend: short. The maximum accumulation of volume for the current contract is located in the range with quotes 4150.00–4200.00. Currently, investment operations on XAUUSD are being executed below this range, indicating seller strength. Medium-term trend: long. The maximum accumulation of volume for the medium-term trend is located in the range with quotes 4113.00-4128.00. Currently, investment operations on XAUUSD are being executed below this range, indicating buyer weakness. The area of favorable prices for buying from the perspective of margin support is located between the 1/4 and 1/2 zones constructed from the maximum of 09.11.2026. Quote for the upper boundary of zone 1/4 – 4097.65. Quote for the upper boundary of zone 1/2 – 4047.15. Intraday targets: update of the maximums from 09.11.2026 – 4148.05. Medium-term targets: test of the lower boundary of the Support and Resistance Zone (SRZ) – 4273.25. Trading recommendations: buy from the favorable price range upon formation of a reversal pattern. Buy: 4047.15–4097.65, Take Profit 1 – 4148.05, Take Profit 2 – 4273.25. Connect Drawdown bonus 101% and trade with double your deposit! Bonus funds will help you increase your profits or withstand a sudden drawdown! You can find more analytical information on our website.
- Last week
-

VIP Membership - FREE upgrade for OLD and ACTIVE Members
Traderbeauty replied to MrAdmin's topic in Announcements
i did check and your old user has a different email so there is no way for me to validate what you are saying. jane -
VIP Membership - FREE upgrade for OLD and ACTIVE Members
Traderbeauty replied to MrAdmin's topic in Announcements
approved enjoy jane -
VIP Membership - FREE upgrade for OLD and ACTIVE Members
Traderbeauty replied to MrAdmin's topic in Announcements
approve enjoy jane pls be more active in the future -
 Myxo9 joined the community
-

VIP Membership - FREE upgrade for OLD and ACTIVE Members
Sukhdev replied to MrAdmin's topic in Announcements
Dear @Traderbeauty Please add me To VIP valut. I was little off from trading. I am member of indo-investasi plus 5 years under user name "Sukhsan" Thanks and regard. Sukhsan -
Market Technical Analysis by RoboForex
RBFX Support replied to RBFX Support's topic in Technical Analysis
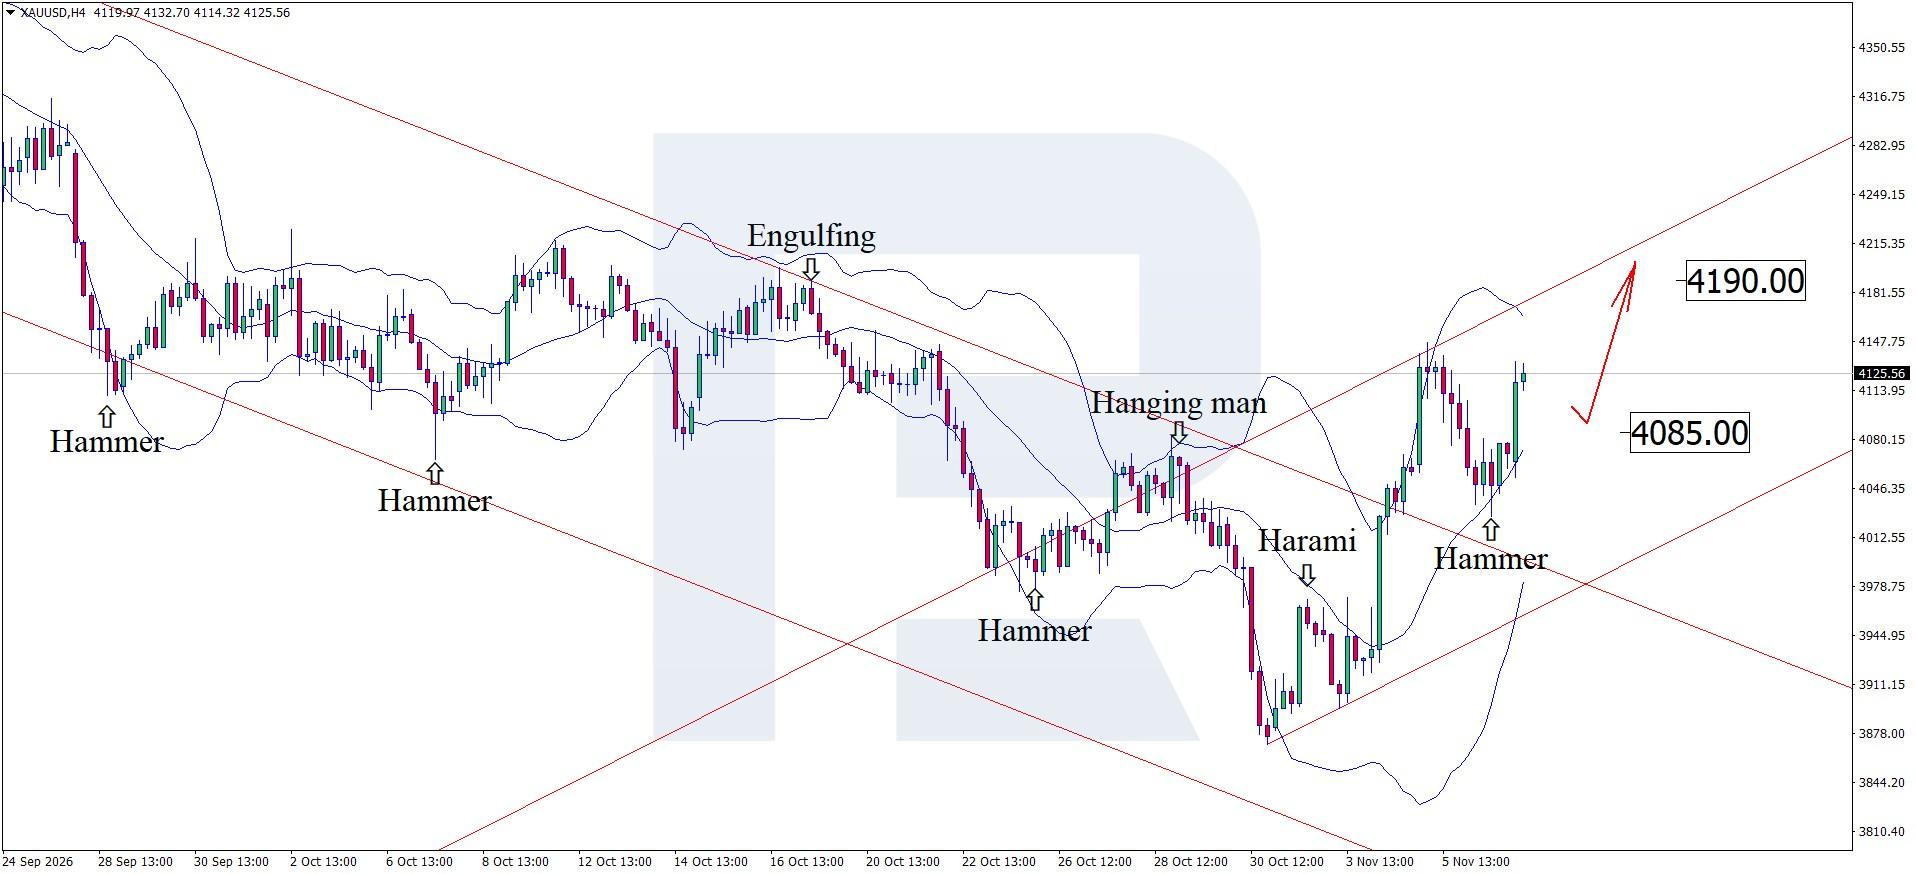
XAUUSD poised for a breakout, with US CPI the key catalyst Gold continues to strengthen following the release of US employment data, with prices currently hovering at 4,125 USD. Technical outlook On the H4 chart, XAUUSD prices have formed a Hammer reversal pattern near the middle Bollinger Band and could extend their upward wave as the pattern's signal plays out. Since XAUUSD remains within an ascending channel, the target for further growth is the 4,190 USD resistance level. Gold continues to recover following the release of US employment data, with US CPI figures set to be the main catalyst this week. Read more - Gold Forecast Attention! Forecasts presented in this section only reflect the author’s private opinion and should not be considered as guidance for trading. RoboForex bears no responsibility for trading results based on trading recommendations described in these analytical reviews. Sincerely, The RoboForex Team
-
roboforex Market Fundamental Analysis by RoboForex
RBFX Support replied to RBFX Support's topic in Fundamental Analysis
Yen weakness persists as USDJPY reverses sharply higher The significant yield differential between the US and Japan remains the main factor supporting the US currency, sustaining demand for dollar-denominated assets. USDJPY forecast: key takeaways US Nonfarm Payrolls increased by 165 thousand, surpassing a forecast of 65 thousand The unemployment rate stood at 4.1%, compared to expectations of 4.2% USDJPY forecast for 9 November 2026: 160.25 Fundamental analysis USDJPY fundamental analysis indicates that the pair retains predominantly upward potential despite growing expectations of further interest rate hikes by the Bank of Japan. The significant yield differential between the US and Japan remains a key factor supporting the US currency, as it continues to drive demand for dollar-denominated assets. The key event of last week was the release of US labour market data for October. Nonfarm Payrolls increased by 165 thousand, well above a market forecast of 65 thousand, while the unemployment rate fell to 4.1%. RoboForex Market Analysis & Forex Forecasts Attention! Forecasts presented in this section only reflect the author’s private opinion and should not be considered as guidance for trading. RoboForex bears no responsibility for trading results based on trading recommendations described in these analytical reviews. Sincerely, The RoboForex Team -

VIP Membership - FREE upgrade for OLD and ACTIVE Members
⭐ Rashid replied to MrAdmin's topic in Announcements
Dear Admin, Do you care to consider granting me access to VIP Vault. Thanks in advance. -
HFMarkets (hfm.com): Market analysis services.
AllForexnews replied to AllForexnews's topic in Fundamental Analysis
Date: 9th November 2026. Gold Above $4,000 for now: US Inflation and Iran Tensions in Focus The markets last week felt the full effect of the midterm elections and the Democratic wins in the house and the senate. The stock market felt the full force of a market selloff while most safe haven assets rose in value. Economists also note that volatility after the midterms was slightly higher than the recent average reaction. However, investors are now turning their attention to the Iran conflict, oil prices, and inflation. Economists expect the US inflation rate to rise from 3.7% to 3.9%, making a December rate hike close to certain. Gold Attempts To Maintain Bullish Momentum The inflation rate, as well as the Middle East conflict, will have a considerable impact on Gold prices. After a sharp decline in October, Gold prices are improving due to their safe-haven status and the midterm elections. The price of Gold has risen above the $4,000 psychological level and is so far maintaining a price above this level. On the 1-minute chart, Gold is experiencing heightened intraday volatility following its recent recovery. On these smaller timeframes, the price is showing strong bearish momentum and strength, creating a strong bearish bias. The price is also trading below key moving averages and forming clear breakouts. However, on the 30-minute chart, the technical outlook remains cautiously bullish, although a slight further decline will weaken all bullish indications. In order for bullish signals to strengthen, the price needs to rise above $4,116.00. Below $4,090, the price is likely to become more bearish. Only on the 4-hour chart, Gold is showing real signs of a bullish recovery, supported by higher lows and improving momentum. The RSI has recently been around 63, indicating positive momentum without reaching traditionally overbought territory. However, the broader trend remains vulnerable following recent selling pressure. HFM - Gold 10-Minute Chart The issue for Gold is the decline in the stock market, demand for bonds, and the strength of the US Dollar. While inflation is likely to rise and the Federal Reserve continues increasing interest rates, any upward price movement remains restricted. The US Dollar continues to trade above the 100.00 level, which is negative for Gold. If the US inflation rate or core inflation data come in higher than the market's current expectations, Gold is likely to decline back towards its support levels. Currently, 80% of market participants believe the Federal Reserve will hike interest rates in December 2026. Crude Oil Declines on Bearish Trump Comments Crude oil prices are trading close to $90.00 per barrel, which remains elevated but much lower than in recent weeks. The lower oil prices go, the more positive it is for Gold. The key influencing factor for oil prices will remain the Middle East conflict. US President Donald Trump has indicated that further military strikes against Iran are highly unlikely, provided negotiations over Tehran’s nuclear programme and the reopening of the Strait of Hormuz continue to progress. Speaking to CNN last night, Trump emphasised that avoiding military action depends on Iran agreeing to a strong diplomatic deal. However, Marco Rubio, the Secretary of State, was less optimistic. Mr Rubio said that he wouldn’t say the US is on the verge of a breakthrough in talks on ending the conflict with Iran. If tensions escalate again, oil prices could rise above $100 per barrel, pressuring inflation and Gold prices. Technical analysis is less viable for Oil prices due to the nature of the asset. However, if the price falls below $89.16 per barrel, momentum indicators will point towards the price declining further. Key support levels for the asset are $87.00 and $80.20 per barrel. Key Takeaways: Gold holds above $4,000 as safe-haven demand supports prices following the US midterm elections and heightened stock market volatility. Gold’s technical outlook remains mixed, with bearish momentum dominating shorter timeframes while the 4-hour chart indicates a potential bullish recovery. US inflation could rise to 3.9%, strengthening expectations of another Fed rate hike in December, potentially limiting Gold’s upside. Oil prices remain sensitive to US-Iran negotiations, with crude trading near $90 per barrel. Renewed military escalation could push prices above $100, increasing inflationary pressures. Please note that times displayed based on local time zone and are from time of writing this report. Click HERE to access the full HFM Economic calendar. Want to learn to trade and analyse the markets? Join our webinars and get analysis and trading ideas combined with better understanding of how markets work. Click HERE to register for FREE! Click HERE to READ more Market news. Michalis Efthymiou HFMarkets Disclaimer: This material is provided as a general marketing communication for information purposes only and does not constitute an independent investment research. Nothing in this communication contains, or should be considered as containing, an investment advice or an investment recommendation or a solicitation for the purpose of buying or selling of any financial instrument. All information provided is gathered from reputable sources and any information containing an indication of past performance is not a guarantee or reliable indicator of future performance. Users acknowledge that any investment in Leveraged Products is characterized by a certain degree of uncertainty and that any investment of this nature involves a high level of risk for which the users are solely responsible and liable. We assume no liability for any loss arising from any investment made based on the information provided in this communication. This communication must not be reproduced or further distributed without our prior written permission.