All Activity
- Past hour
-
 ⭐ ralph kabota reacted to a post in a topic:
advancedsoftwarefeatures.com
⭐ ralph kabota reacted to a post in a topic:
advancedsoftwarefeatures.com
-
Algo Traders need to be fix. ABCMagic_S06012023.zip BaselineBounce_S06022023.zip BaselineBounce System - User Manual v1.pdf BBTemplates.zip Setup and Activation Manual.pdf ABCMagic System - User Manual v2.pdf Setup and Activation Manual.pdf
-
⭐ ralph kabota reacted to a post in a topic:
advancedsoftwarefeatures.com
-
NinZa Best Alligator need to be fix NinZa - Be$t Alligator, (ninza.co).zip
-
Order Blocks with Market Structure - Manual 2.0 Order Blocks with Market Structure - Manual 2.0.pdf
- Yesterday
-
roddizon1978 reacted to a post in a topic:
bwt presicion trading nt8 please give
-
⭐ rcarlos1947 reacted to a post in a topic:
advancedsoftwarefeatures.com
-
Koroni reacted to a post in a topic:
advancedsoftwarefeatures.com
-
Koroni reacted to a post in a topic:
advancedsoftwarefeatures.com
-
A few more https://workupload.com/file/uVL8eDUYyPF Thanks
- 1 reply
-
- 3
-
-
-
kidpe reacted to a post in a topic:
Hier noch OrderBlocksPlus
-
ORB_TradeSaber_V1.2.zip
-
Liquiditätsvolumen IQ NT8.zip
-
fxtrader99 reacted to a post in a topic:
Hier noch OrderBlocksPlus
-
⭐ trader65 reacted to a post in a topic:
bwt presicion trading nt8 please give
-
⭐ trader65 reacted to a post in a topic:
bwt presicion trading nt8 please give
-
What is special about this Alligator one? Just moving average cross signals as far as I see. Just plot 2 MAs and you have the same thing. Many free ones out there that have MA cross clouds.
-
Thanks, what do i pick for connection type, there are so many. how do i set up connection , I am subscribed to live data.
-

bwt presicion trading nt8 please give
ninja_under_da_roof replied to xplodvicky's topic in Ninja Trader 8
Don't waste time on BWT. Just like Beauty and I have said. Nothing is so special about it. If anything at all, the only one I would use from it is the Oscillator. It reacts fairly quickly to price movement and accurate. At least in my view. The other one I would use is the Core Levels. But that's pretty much it. The AutoTrader isn't something I would care about. Especially if you wanna use to trade prop firms. Drawdowns will kill you with their trailing rules. However, as I understand, BWT does have templates specifically made for the PA phase that handle the drawdown trailing. For the Test phase, they use different templates. To be able to figure out which templates they actually use for, with hundreds of templates you have, without instructions and guides, would be time consuming and a waste. -
bwt presicion trading nt8 please give
ninja_under_da_roof replied to xplodvicky's topic in Ninja Trader 8
Most likely, since you allowed ninja to replace the files, the previous ones you had in your pc, require to have those files, causes you to have those errors. Thats the issue. You get what you need for BWT to work, but you cause issues for the others that are now missing the files you replaced. If you want to have those errors gone. Most likely, you need to check and see which other indicators you have before installing this BWT, that use the same file names, and add them back. -
Welcome to Indo-Investasi.com. Please feel free to browse around and get to know the others. If you have any questions please don't hesitate to ask.
-
 Could you send the Telegram link or name, please?
 -
biuro.acton joined the community
-
-
If you have more pls send it https://workupload.com/file/FVCAbLSArpB Thanks
-
Hello All & Mr Kesk in special particular. Here I offer some insight and feedback on TS: Having used TS for some years, I am yet to decide that it is useful in actually making money from trading.For new users, it is a mistake to think that simply pressing a button leads to a successful forecast or ability to make money. I think the usefulness of the software is its use as a tool to compare the mathematical goodness of fit between two data sets, one of which does not necessarily need to be stock market data. You could think that if two data sets have a longtime high correlation this will continue into the future, and this is the basis of this software’s “projection line’ technique. The new feature of “ÄI Expert” is in my opinion, more marketing than major analysis advance. I have tested it out, and it is not “artificial intelligence” in any modern sense: what it actually is, is the equivalent of a macro or an old style MS-DOS “.bat” (batch) file. ie. By pressing that single button, it runs a fixed and predetermined sequence of the analyses modules that already exist elsewhere in the program with an added fixed text based “interpretation’ which is only really the author’s own descriptive words of the outcome rather than any real generative AI. You can get the same results by running the modules individually. My review of the quality of these results is that they are not impressive, often indeterminate, and left up to the users own interpretation. The problem with this approach is that the standardised batch process is “vanilla”: i.e. it is similar output whichever instrument you run the software on and the results are only a mediocre correlation. As an example, with almost any of the instruments, the “Ëxpert” produces a medium correlation with the Venus Astro cycle, but when reviewed to the naked eye, it is not a particularly good or useful correlation. A really functioning AI would give vastly different outputs with differing instruments as inputs. To make the most of this still powerful software tool what is actually required is “RI” ie. Real (human) Intelligence: that means use the software to make easy work of the otherwise complicated mathematical analysis of your own learning and human interpretation of what correlation is likely to help in your trading. I give this information to readers as a realistic and real-world feedback, so less experienced people are not unrealistically feeling left out without access to this new “feature”. I am not saying the software is not useful in someway, I just do not think it is useful in a direct way to make money from trading.
-
Here is a link for a FREE educated version - enjoy https://t.me/ninjatrader_trading1/13 https://t.me/ninjatrader_trading1/15
-
 Suheb joined the community
 -
OrderBlocksPlus_II210924.zip
-
 Obsidian_Overwatch_v1.3.zip
 -

roboforex Market Fundamental Analysis by RoboForex
RBFX Support replied to RBFX Support's topic in Fundamental Analysis
OPEC and US sanctions light the fuse – Brent targets new highs The outlook for Brent appears bullish, with prices gaining momentum amid US dollar weakness and likely to reach the 67.70 USD resistance level. Find more details in our analysis for 17 April 2025. Brent forecast: key trading points Brent crude oil continues its upward move Philadelphia Fed Manufacturing Index (US): previously at 12.5, projected at 2.2 Brent forecast for 17 April 2025: 67.70 USD Fundamental analysis Today’s fundamental analysis for Brent takes into account that prices are rising steadily, trading near 66.85 USD per barrel, its highest level since the start of the month. The recent rally is driven by new US sanctions targeting Iran’s oil exports, including penalties on a Chinese refinery. Prices are also supported by additional voluntary oil output cuts announced by some OPEC members, such as Iraq and Kazakhstan. According to the forecast for 17 April 2025, the Philadelphia Fed Manufacturing Index is expected to drop sharply to 2.2 from the previous 12.5. Such a decline would signal weakening US industrial activity, likely weighing on the US dollar. RoboForex Market Analysis & Forex Forecasts Attention! Forecasts presented in this section only reflect the author’s private opinion and should not be considered as guidance for trading. RoboForex bears no responsibility for trading results based on trading recommendations described in these analytical reviews. Sincerely, The RoboForex Team -
Market Technical Analysis by RoboForex
RBFX Support replied to RBFX Support's topic in Technical Analysis
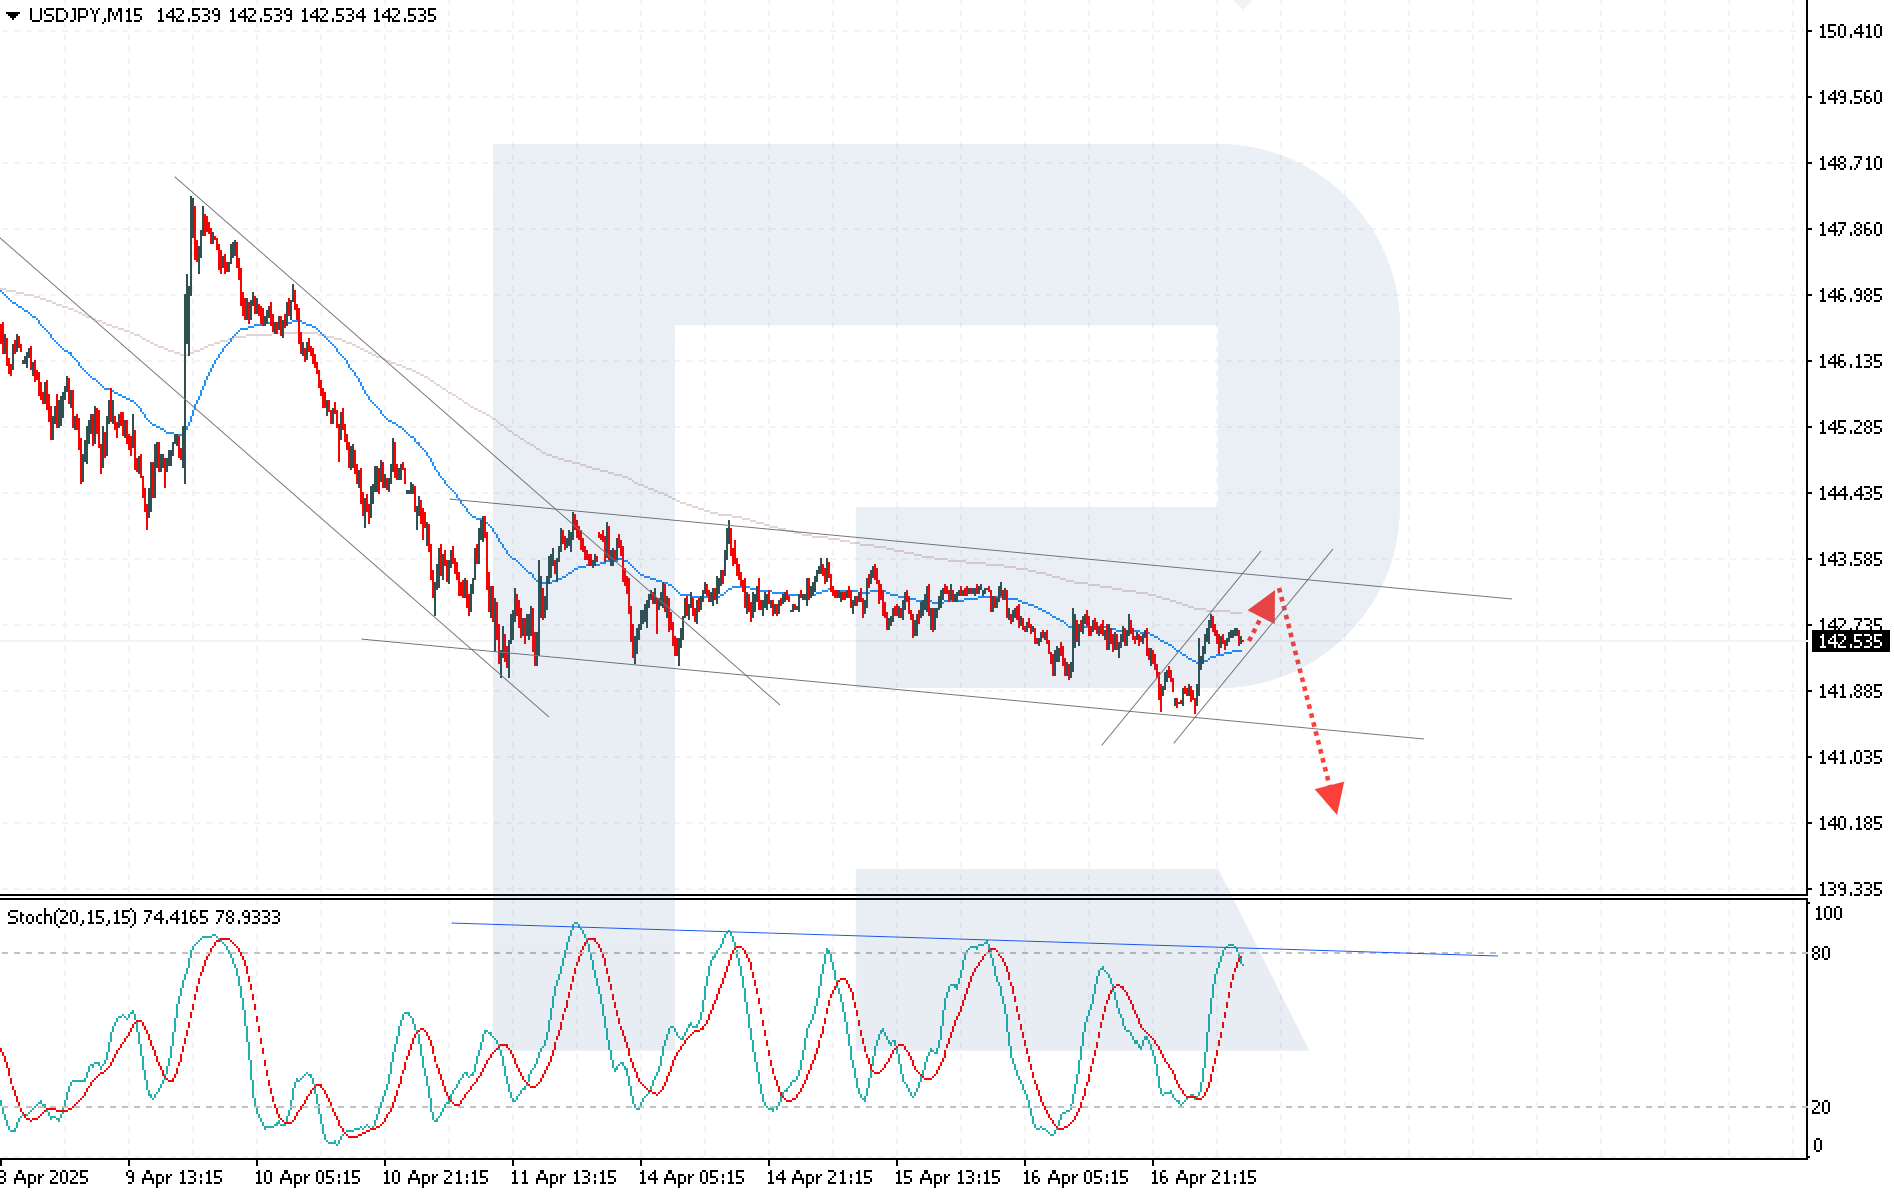
USDJPY: correction complete? The yen loses ground under Fed pressure The USDJPY rate has risen to 142.77 after weak Japanese data and hawkish remarks from Jerome Powell. Discover more in our analysis for 17 April 2025. USDJPY technical analysis The USDJPY rate has climbed after rebounding from the lower boundary of a bearish channel. Today’s USDJPY forecast suggests the current recovery could stall near 142.75, followed by bearish momentum and decline towards 140.20. The yen is under pressure from hawkish Fed signals and weak Japanese export data. Read more - USDJPY Forecast Attention! Forecasts presented in this section only reflect the author’s private opinion and should not be considered as guidance for trading. RoboForex bears no responsibility for trading results based on trading recommendations described in these analytical reviews. Sincerely, The RoboForex Team
-

HFMarkets (hfm.com): Market analysis services.
AllForexnews replied to AllForexnews's topic in Fundamental Analysis
[b]Date: 17th April 2025.[/b] [b]Economic Data Lifts Crude Oil — Will Resistance Stall the Rally?[/b] Crude Oil prices rise for a second consecutive day due to supply chain concerns and positive Chinese data. The price of Crude Oil rose 1.58% on Wednesday, and a further 1.15% during this morning’s Asian session. However, this upward price movement has taken the asset to the key resistance level at $62.70. Is the price about to witness a decline due to the current resistance level? Why are Oil Prices Increasing? One of the main reasons why Crude Oil prices have been increasing in value is the positive economic data from China. China and the US hold the biggest influence over Crude Oil demand as the two countries are the largest importers. China's first quarter’s gross domestic product (GDP) grew by 5.4%, surpassing the projected 5.2%. However, analysts attribute this growth to a surge in demand for Chinese goods ahead of the anticipated tariff war and predict a potential slowdown by year-end. Nonetheless, the oil market reacted positively to the news that the Chinese economy saw better figures than previously expected. Traders will be watching closely to see if deteriorating economic data in the coming months, driven by trade policy, will put downward pressure on prices. Crude Oil The US also made public positive economic data from Retail Sales. The Retail Sales figure rose by 1.4%, the highest in more than 12 months. The Core Retail Sales also rose by 0.5%, higher than the projected figure and the previous month. Furthermore, the US, UK and Japan have confirmed they will begin negotiating a trade agreement with the US. The tone is positive and can have a positive impact on the price of Oil. However, the key factor for the Oil market is whether the US will come to an agreement with China. In terms of supply, Iraq and Kazakhstan have announced additional output cuts to keep supply controlled. In addition to this, the US is imposing additional sanctions on Iranian oil which is further pressuring the supply side. Restrictions on supply chains are known to push prices higher. The Federal Reserve and How the Economy Will Influence Crude Oil? Even though economic data surprised the market and provided a positive tone for many assets, the Federal Reserve was less positive. The Chairman, Mr Jerome Powell spoke towards the end of the US session discussing inflation, employment and interest rates. According to Mr Powell, the Tariffs imposed by the US administration were higher than previous expectations. According to the Fed, the trade policy is likely to trigger higher inflation, but it is unclear whether the higher inflation will be temporary or long-term. The Consumer and Producer Price Index over the next 3-6 months will be key for the Federal Reserve. The key statement that captured investors' attention was the chairman's remarks regarding the Federal Reserve's primary focus. Powell said, ‘without price stability, we cannot achieve long periods of strong labor market conditions’. This comment was a clear indication that the Federal Reserve will concentrate on controlling inflation and will allow the employment sector to be temporarily hit. The hawkish tone from the Fed can be seen in the Fedwatch Tool. The expectations of a pause have risen 14% over the past week, mainly due to the speech yesterday. However, the market still believes the Federal Reserve will cut in June 2025. Crude Oil - Technical Analysis The main concern for Crude Oil is the resistance level at $62.70, the domino effect of a Federal Reserve reluctant to cut rates and if the so-called ‘trade war’ escalates. As the price rose to the resistance level this morning, the asset quickly declined. Nonetheless, on a 2-hour chart, the asset remains above the trend line and above the neutral area of the RSI. However, the price is below the Volume-weighted average price. Therefore, we have conflicting signals. Crude Oil However, if the price continues to decline and establish itself below the 200-bar simple moving average in the 3-minute timeframe, the sell signals are likely to strengthen. Key Takeaway Points: Oil prices rose for a second day, driven by strong Chinese GDP, OPEC+ supply cuts, and renewed sanctions on Iran. Positive economic data from China and the US boosted demand outlook, though analysts warn China's growth may slow due to upcoming tariffs. The Fed maintained a hawkish stance, prioritizing inflation control, and raising uncertainty about rate cuts despite strong economic figures. Trade talks with the US, UK, and Japan lifted market sentiment, but concerns remain over a potential escalation in the US-China trade dispute. [b]Always trade with strict risk management. Your capital is the single most important aspect of your trading business.[/b] [b]Please note that times displayed based on local time zone and are from time of writing this report.[/b] Click [url=https://www.hfm.com/hf/en/trading-tools/economic-calendar.html][b]HERE[/b][/url] to access the full HFM Economic calendar. Want to learn to trade and analyse the markets? Join our webinars and get analysis and trading ideas combined with better understanding of how markets work. Click [url=https://www.hfm.com/en/trading-tools/trading-webinars.html][b]HERE[/b][/url] to register for FREE! [url=https://analysis.hfm.com/][b]Click HERE to READ more Market news.[/b][/url] [b]Michalis Efthymiou HFMarkets[/b] [b]Disclaimer:[/b] This material is provided as a general marketing communication for information purposes only and does not constitute an independent investment research. Nothing in this communication contains, or should be considered as containing, an investment advice or an investment recommendation or a solicitation for the purpose of buying or selling of any financial instrument. All information provided is gathered from reputable sources and any information containing an indication of past performance is not a guarantee or reliable indicator of future performance. Users acknowledge that any investment in Leveraged Products is characterized by a certain degree of uncertainty and that any investment of this nature involves a high level of risk for which the users are solely responsible and liable. We assume no liability for any loss arising from any investment made based on the information provided in this communication. This communication must not be reproduced or further distributed without our prior written permission. -
I imported the zipped file ad usual NT mode and then replaced the files in the "bin/custom" folder inside */document/bin/custom .....obviously with this procedure was also copied Xceed.Wpf.Toolkit.dll file. I don't know if it's right. All everythings is OK but at the start I have 3 alert I show in my previous post