

⤴️-Paid Ad- Check advertising disclaimer here. Add your banner here.🔥
All Activity
- Today
-

Are prizes and awards from brokers real?
bluemac replied to hafidfx's topic in Trading Contests & Bonuses
Exactly this. Prize is classified as income in most countries, broker won't withhold for you. Cash prize shows as trading income / other income, non-cash (car, phone) valued at market price then taxed. Better keep winning email and value proof for your tax guy. Don't assume HFM handled it. -
Entry gets likes, exit pays your bills and most blow on position sizing, not entry.
-
Using ULE module with various options is explained in this PDF. Those who are interested can read it. However, based on the discussions on their forum, I still have my 'nagging' doubt about the capability of the program. For different approaches, he choses different stocks (nit picking?). My question is why not chose the same stock for all explanations? May be there is a different view which I am not able to comprehend. This Astrology/astronomy/ULE/NN/etc is all mumbo/jumbo when it comes to financial market -:) List_ULE.pdf
-
 Pow reacted to a status update:
Welcome to Indo-Investasi.com. Please feel free to browse around and get to know the
Pow reacted to a status update:
Welcome to Indo-Investasi.com. Please feel free to browse around and get to know the
-
I'm here because, frankly, I've had enough of Reddit and its fake conversations. A little about myself. I'm not here looking for someone to teach me how to trade. I've already got quite a bit of experience under my belt, from trading psychology to algorithmic trading. That said, I'm always up for a good exchange of ideas and practical experience. So if anyone has questions about automating trading strategies, connecting different platforms, or dealing with the technical side of algo trading, I'll be happy to throw in my two cents. Looking forward to some real discussions around here.
-
 Analyze the market with AI: new opportunities in MetaTrader 5 What is happening on the chart? What events should be considered before making a trade? How to evaluate the results of a trading robot? In MetaTrader 5, you can ask these questions using the built-in AI Assistant — directly in the trading terminal. The assistant works with platform data: quotes, charts, open positions, and trade history. You describe the task in plain language, and the AI uses available tools to perform it and prepare an analysis. $25 for a risk-free start! Register, complete verification, enter promo code INDOINVEST10 in your Personal Area, and get a trading bonus with no deposit required. What you can assign to the assistant: Analyze a chart. Ask to analyze the selected instrument and timeframe, assess the direction of movement, and identify nearby support and resistance levels. Prepare technical analysis. The assistant can add indicators to the chart and set their parameters. For example, set two moving averages with periods of 20 and 50. Study expert advisor results. The AI receives strategy tester reports, compares optimization results, and helps identify potential issues in the trading robot's operation. More capabilities after updates In the September versions of MetaTrader 5, the assistant's capabilities have expanded. It can now retrieve expert advisor parameters and prepare them for testing, run experts and scripts on charts, and work with the built-in economic calendar. This allows combining multiple tasks in one request: for example, analyzing price movement while taking into account upcoming economic data releases. New tools are available in Build 6230 and later versions. How to get started Update the desktop MT5 terminal. The build number can be checked in the menu Help → About. Log in to your account MQL5.community via Service → Settings → Community. This is a separate account, not a trading account login. Check the settings on the tab AI Assistant. By default, the free model is used MQL5 Lite. Click the icon AI on the terminal's top panel and write your request. Start with a simple task: Analyze EURUSD on H1. Determine the current trend, nearby support and resistance levels, and briefly explain your conclusions. Control of trading actions — in your hands In the settings, you can prohibit the assistant from making trades or allow them only after your confirmation. You choose which actions are available to the assistant. Open MetaTrader 5 and try AI Assistant in action — start by analyzing the instrument you trade. Open a New MT5 Account
 -
 samjan changed their profile photo
 -
 Pow joined the community
 -
samjan joined the community
-

roboforex Market Fundamental Analysis by RoboForex
RBFX Support replied to RBFX Support's topic in Fundamental Analysis
US 500: historically, quotes rise after midterm elections Since 1950, the US 500 index has delivered an average return of 17.2% in the year following midterm elections, according to Silvia Insights experts. US 500 forecast: key takeaways Investors are awaiting inflation data on 14 October The yield on 30-year US Treasuries fell to 5.62% US initial jobless claims came in at 197 thousand Fundamental analysis The US initial jobless claims data published on 8 October 2026 indicates that the US labour market remains resilient. The figure came in at 197 thousand claims versus a forecast of 200 thousand, down from the previous week's revised reading of 199 thousand. The short-term impact of the release on the US 500 index can be assessed as neutral, bringing a moderately positive effect on corporate fundamentals, yet posing the risk of a negative price reaction driven by interest rate expectations. RoboForex Market Analysis & Forex Forecasts Attention! Forecasts presented in this section only reflect the author’s private opinion and should not be considered as guidance for trading. RoboForex bears no responsibility for trading results based on trading recommendations described in these analytical reviews. Sincerely, The RoboForex Team -
Market Technical Analysis by RoboForex
RBFX Support replied to RBFX Support's topic in Technical Analysis
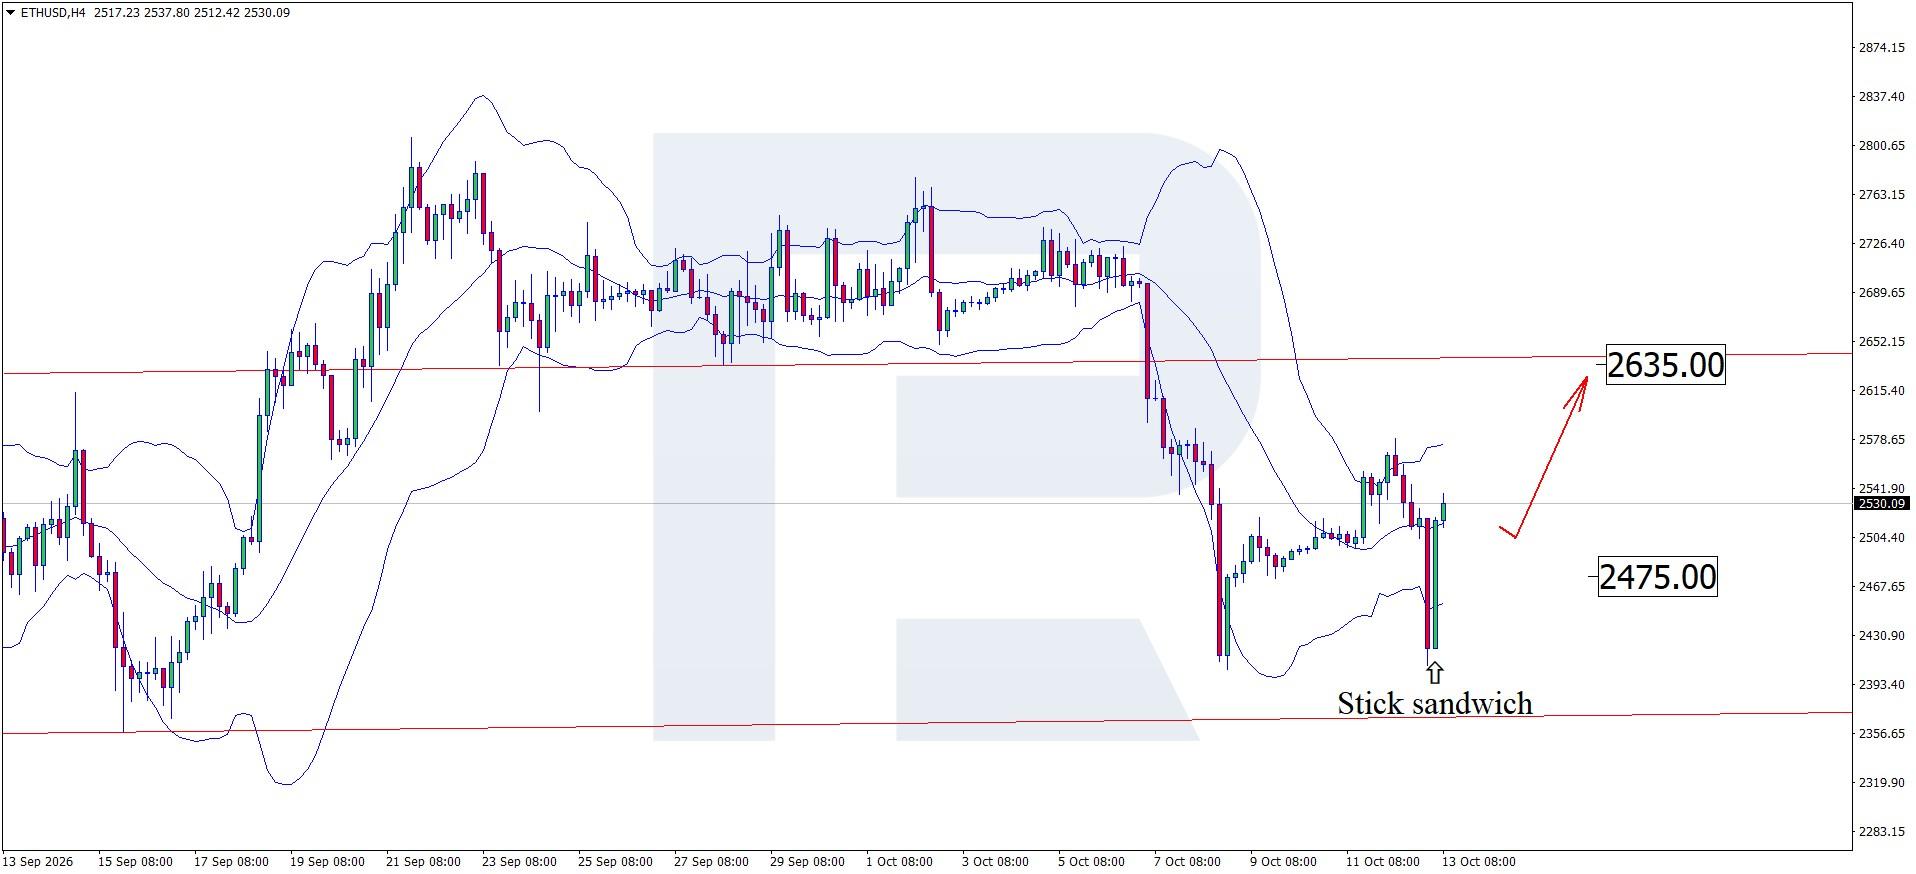
Ethereum awaits a signal from the Fed: a single inflation report could change market sentiment Ethereum is attempting to recover ahead of the release of US CPI data, currently trading at 2,530 USD. Technical outlook On the ETHUSD H4 chart, the price has formed a Stick Sandwich reversal pattern near the lower Bollinger Band. At this stage, it could continue its upward trajectory as the pattern's signal plays out, with the upside target at the 2,635 resistance level. Regulatory changes and potential ETH accumulation by major investors remain supportive factors. Read more - ETHUSD Forecast Attention! Forecasts presented in this section only reflect the author’s private opinion and should not be considered as guidance for trading. RoboForex bears no responsibility for trading results based on trading recommendations described in these analytical reviews. Sincerely, The RoboForex Team
-

VIP Membership - FREE upgrade for OLD and ACTIVE Members
lis22 replied to MrAdmin's topic in Announcements
can i be added to vip membership -

HFMarkets (hfm.com): Market analysis services.
AllForexnews replied to AllForexnews's topic in Fundamental Analysis
[B]Date: 13th October 2026.[/B] [B]High Volatility Ahead of US Inflation as IMF Warns of Global Risks.[/B] The US Dollar Index is falling during Tuesday’s Asian session after rising to the highest level in six months. The decline is due to falling bond yields and markets pausing ahead of the release of the US inflation rate. The US Dollar Index has been increasing in value for almost five consecutive weeks. Investors are warning that the quick rise is prompting slightly overstretched indications unless tomorrow's inflation reads higher. Volatility in bonds, gold, currencies, and indices are also being driven by the latest statements from Broadcom and the IMF. Broadcom, the eighth most influential company in the NASDAQ and a key player in AI, has raised concerns about growing speculation in the sector. Its CEO warned that AI investing is becoming ‘casino-like’, with many investors lacking understanding and holding unrealistic expectations. As a result, the NASDAQ and S&P 500 are declining in value, while the Dow Jones is experiencing a strong gain. This is due to the Dow Jones’s exposure to defensive stocks and the banking sector. The banking sector is due to announce their earnings reports before the market opens on Tuesday. USD/CAD - The Dollar Loses Momentum as Investors Turn to Bonds The US Dollar Index is experiencing strong gains due to expectations of higher interest rates for a prolonged period. In addition, the currency is also experiencing demand due to high bond yields and its safe-haven status. At the same time, the Canadian dollar continues to come under pressure from US trade demands, weak economic growth, and political uncertainty. A key factor that is impacting safe-haven assets is the latest IMF statement. The IMF’s statement on 13 October felt more like a warning rather than a neutral statement. According to the statement, the global economy is becoming increasingly vulnerable to further shocks, particularly as government bond yields rise and public debt remains elevated. The statement also made reference to the rising energy prices and possible AI-related market risks. As a result, many safe-haven assets are increasing in value. These include, Gold, bonds, the Japanese Yen and the Swiss Franc. The US Dollar on the other hand, saw a small decline due to higher bond demand and the upcoming inflation report. Many investors will wait to see what the latest inflation figure will indicate for monetary policy. Market analysts expect inflation to rise from 3.4% to 3.6%. If the inflation figure comes in higher, the US Dollar could again see an increase. However, a lower figure or a reading line with expectations may see the daily fall continue into a correction. Without a considerable rise in inflation, the Federal Reserve is likely to pause in October. USDCAD - Technical Analysis In terms of technical analysis, on the daily timeframe, indications remain bullish, but the picture seems overstretched at such a high price. The USD/CAD has risen for six consecutive weeks, but has been struggling to rise further over the past week. Nonetheless, the shorter-term timeframes are not indicating a downward trend, and downward retracements are losing momentum. At the same time, on the short- and medium-term charts, the price continues to trade above the key moving averages. Gold Rebounds, but Inflation Remains Key Gold prices saw a strong rise this morning after declining on Monday. The key drivers were the decline in bond yields for a second consecutive day, ‘risk off’ appetite, and a slight decline in the Dollar. However, traders should note that the US Dollar Index remains elevated and above 102.00. While the short-term price action remains above 102.00, gold may struggle to maintain bullish momentum. At the same time, Gold will also be influenced by the upcoming US inflation reading. If the inflation reading is higher than expected, Gold may decline in the short term. However, a decline or slight rise will likely benefit Gold as the Fed may opt to keep rates unchanged for the rest of the year. The price of Gold was trading 0.64% higher this morning but is retracing lower as the European session nears. If the price rises above $4,194.40, bullish indications will likely remain intact. If the price falls below $4,181.00, buy signals will be erased until bullish momentum is seen again. HFM - Gold 1-Hour Chart Key Takeaways: The Dollar retreats from a six-month high as bond yields decline and investors await US inflation data. The IMF warns of growing economic vulnerabilities, while Broadcom raises concerns about excessive AI speculation. The USD/CAD remains bullish but shows signs of overextension, with upcoming inflation data likely to influence its next move. Gold benefits from declining bond yields and safe-haven demand, with $4,194.40 acting as key resistance and $4,181.00 as support. [B]Always trade with strict risk management. Your capital is the single most important aspect of your trading business.[/B] [B]Please note that times displayed based on local time zone and are from time of writing this report.[/B] Click [URL='https://www.hfm.com/hf/en/trading-tools/economic-calendar.html'][B]HERE[/B][/URL] to access the full HFM Economic calendar. Want to learn to trade and analyse the markets? Join our webinars and get analysis and trading ideas combined with better understanding of how markets work. Click [URL='https://www.hfm.com/en/trading-tools/trading-webinars.html'][B]HERE[/B][/URL] to register for FREE! [URL='https://analysis.hfm.com/'][B]Click HERE to READ more Market news.[/B][/URL] [B]Michalis Efthymiou HFMarkets[/B] [B]Disclaimer:[/B] This material is provided as a general marketing communication for information purposes only and does not constitute an independent investment research. Nothing in this communication contains, or should be considered as containing, an investment advice or an investment recommendation or a solicitation for the purpose of buying or selling of any financial instrument. All information provided is gathered from reputable sources and any information containing an indication of past performance is not a guarantee or reliable indicator of future performance. Users acknowledge that any investment in Leveraged Products is characterized by a certain degree of uncertainty and that any investment of this nature involves a high level of risk for which the users are solely responsible and liable. We assume no liability for any loss arising from any investment made based on the information provided in this communication. This communication must not be reproduced or further distributed without our prior written permission. -
--
-
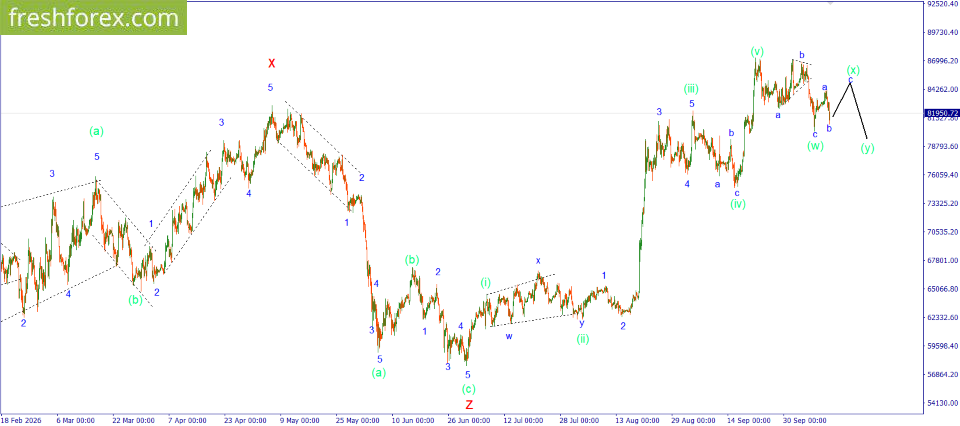
Elliott wave analysis of the market for October 13, 2026 BTCUSD $25 for a risk-free start! Register, complete verification, enter promo code INDOINVEST10 in your Personal Area, and get a trading bonus with no deposit required. BTCUSD: BUY 82000, SL 81000, TP 84500. Earlier there were concerns that the Bitcoin correction had ended. Although a good zigzag had formed at that time, it turned out to be disproportionate to the previous impulsive rise. It lacked a bit of scale. And now we see that the price has sharply returned to the lows of that very zigzag, thereby confirming the assumption about the complication of the corrective structure. At the moment, the formation of a double zigzag is assumed, in which wave (x) is currently forming. If this is indeed the case, then in the near future we will see another attempt to rise, which will also fail, but on this move you can try to make money. For this, you can cautiously buy at current levels with a target near the local maximum. Investment idea: BUY 82000, SL 81000, TP 84500. Connect Drawdown bonus 101% and trade with double your deposit! Bonus funds will help you increase your profits or withstand a sudden drawdown! You can find more analytical information on our website.
-
Welcome to Indo-Investasi.com. Please feel free to browse around and get to know the others. If you have any questions please don't hesitate to ask.
-
 tradersibu joined the community
 - Yesterday
-

VIP Membership - FREE upgrade for OLD and ACTIVE Members
Traderbeauty replied to MrAdmin's topic in Announcements
Approved- its a realy pleasure having you here for 13 years. Enjoy your VIP. Soon- only VIP members will be able to go inside the vault or to share links and files. Take care Traderbeauty-Jane -

VIP Membership - FREE upgrade for OLD and ACTIVE Members
⭐ sunny818 replied to MrAdmin's topic in Announcements
Dear Traderbeuty, could you please add me to the VIP Vault? I am a long-time member. Thank you in advance. -
Weekly Review: XAUUSD, #SP500, #BRENT | 16 October 2026 $25 for a risk-free start! Register, complete verification, enter promo code INDOINVEST10 in your Personal Area, and get a trading bonus with no deposit required. XAUUSD: BUY 4202.88, SL 4142.88, TP 4334.88 Gold starts the week with support from a weakening dollar and falling oil prices. Cheaper energy reduces fears of an immediate Fed tightening and improves the position of the metal, which does not yield interest income. At the same time, uncertainty in the Middle East maintains interest in safe-haven assets, despite reports of an energy truce in Europe. The main test will be US inflation data: a slowdown could ease yield pressure and support XAUUSD. However, the October Fed pause is already largely expected, and the probability of a December rate hike remains high. Therefore, the growth idea assumes a calm reaction from the bond market to the statistics; accelerating prices and a strengthening dollar could cancel it out. Trading idea: BUY 4202.88, SL 4142.88, TP 4334.88 #SP500: BUY 7836, SL 7766, TP 8011 The corporate earnings season becomes the main test for US stocks. Results from major banks are scheduled for Tuesday, and the current valuation of quarterly profit growth for index companies stands at 29.6% year-on-year. This supports demand for stocks, but strong expectations require confirmation: past results are important, but so are company forecasts. Falling oil prices can ease business costs and reduce concerns about further rate hikes. The limitation remains the high yield on US bonds: it raises investors' requirements for corporate profits. If earnings meet expectations and inflation data does not intensify the pressure on the cost of money, the weekly scenario allows for #SP500 growth. Trading idea: BUY 7836, SL 7766, TP 8011 #BRENT: SELL 101.36, SL 104.36, TP 95.36 For oil, the main change has been expectations of supply expansion. US statements about supplying Russian diesel and stopping attacks on energy facilities weaken deficit fears. However, the durability of the announced truce has not yet been confirmed by both sides. Pressure on #BRENT arises through reduced disruption risk, not through proven production increases. At the same time, attacks on tankers and the expansion of the conflict in the Middle East maintain the threat to export flows. Therefore, the weekly downside idea depends on the emergence of confirmations regarding supply availability and the absence of new serious disruptions. While the market assesses the possibility of a deficit reduction, selling #BRENT remains the base scenario; worsening transport security could cancel it out. Trading idea: SELL 101.36, SL 104.36, TP 95.36 Up to $20 per lot with real funds - get guaranteed income by joining the promotion Cashback! You can find more analytical information on our website.
-
roboforex Market Fundamental Analysis by RoboForex
RBFX Support replied to RBFX Support's topic in Fundamental Analysis
The Fed and US inflation will determine BTC's direction Bitcoin is strengthening ahead of US inflation data, with the price currently hovering around 83,555. BTCUSD forecast: key takeaways Investors are awaiting the release of the US Consumer Price Index on 14 October On 5 October, the CFTC proposed establishing a federal oversight framework for cryptocurrency trading platforms BTCUSD forecast for 12 October 2026: 85,300 Fundamental analysis The Federal Reserve remains a key factor for Bitcoin. Investors are awaiting the release of the US Consumer Price Index on 14 October. An acceleration in inflation could reinforce expectations of further interest rate hikes and reduce the appeal of risk assets, including BTC. Escalating tensions in the Middle East and attacks on energy infrastructure are making investors more cautious. Although Bitcoin is sometimes regarded as an alternative to traditional financial assets. RoboForex Market Analysis & Forex Forecasts Attention! Forecasts presented in this section only reflect the author’s private opinion and should not be considered as guidance for trading. RoboForex bears no responsibility for trading results based on trading recommendations described in these analytical reviews. Sincerely, The RoboForex Team -
HFMarkets (hfm.com): Market analysis services.
AllForexnews replied to AllForexnews's topic in Fundamental Analysis
[B]Date: 12th October 2026.[/B] [B]Dow Jones & Gold: What’s Driving the Rebound.[/B] Gold and the stock market are declining after originally increasing during this week’s market open. The u-turn comes as the US Dollar and Oil prices rebound. The recent key drivers are Russia and Ukraine’s energy ceasefire and also the tensions between Yemen and Saudi Arabia. However, markets expect more volatility and greater clarity following the release of US consumer and producer inflation data later this week. This week will also see the start of earnings season, with major US banks making their earnings reports public. So far, the Dow Jones is the best-performing US index, while the NASDAQ is witnessing the strongest decline. Dow Jones - Earnings & Inflation The Dow Jones rose 0.35% during this morning’s opening hours, rising to its highest level since 25 September. The upward price movement potentially may have been due to the better market conditions, including the weaker Dollar, lower oil prices, and the decline amongst bond yields. Investors may have also been continuing last week’s trend as the market gets ready for this week’s earnings data. However, as the European open edges closer, the positive market conditions are fading. The US Dollar’s decline has come to a halt, and oil prices have risen 2%. For this reason, markets are becoming cautious, but the VIX index remains 1% lower, maintaining a ‘risk-on’ sentiment. The main market pressures are currently coming from high bond yields and the Middle East. The geopolitical tensions in the Persian Gulf and the risk of Houthi disruptions to the Bab-el-Mandeb Strait, a key oil shipping route, remain in the spotlight. Meanwhile, easing Fed hawkishness, stabilising inflation, and signs of economic cooling weigh on prices. Currently, 82.8% of the market believes rates will remain unchanged in October. This is likely to remain the case unless inflation rises higher than the current expectations. For this reason, this week’s events will be vital in determining how the index will move in the upcoming days. Markets expect the US inflation rate to rise from 3.4% to 3.6%. If the inflation rate rises above this level, the Dow Jones can come under pressure, particularly if oil prices also remain above $90. However, if inflation does not rise to 3.6%, the Dow Jones may continue to rebound higher. The possible rebound will be particularly strong if supported by positive earnings data. Goldman Sachs Earnings Report The Dow Jones will be strongly influenced by the earnings reports of Goldman Sachs, UnitedHealth, Johnson & Johnson and JPMorgan. However, the strongest driver will be the earnings report from Goldman Sachs. Currently, Goldman Sachs stock is the most influential for the index as it holds a weight of more than 10%. This year, the stock has risen almost 6%. Analysts expect earnings per share of approximately $12.90 and revenue of $16.87 billion, representing an estimated 11.1% annual revenue increase. The bank is expected to benefit from stronger investment banking activity, particularly mergers and acquisitions, corporate advisory services, and underwriting. However, trading revenues could face seasonal pressure following an exceptionally strong second quarter, while rising operating expenses may weigh on profitability. The fundamental outlook for Goldman Sachs remains cautiously positive, supported by continued demand for investment banking services and corporate transactions. The bank has exceeded earnings expectations for four consecutive quarters, increasing expectations for another positive surprise. However, tomorrow's market reaction will depend not only on whether earnings exceed forecasts but also on trading performance, cost management, and management's outlook for Q4. If Goldman Sachs shares increase in value after tomorrow’s earnings release, the Dow Jones can also find major support. However, the upward price movement will also depend on the US Consumer Price Index as well as the less important earnings reports. Will Gold’s Rebound Continue? Gold, which has been struggling since late August, rose in value at the end of last week, taking the price to a key resistance level. The increase was partly driven by investors taking advantage of lower prices following Wednesday’s sharp decline. Additionally, expectations that the Federal Reserve will keep interest rates unchanged in October provided further support. So far this morning, the price has seen an impulse wave in both directions. In the medium term, the Consumer Price Index and Producer Price Index will help determine Gold's price action. Whereas, in the short term (Monday alone), markets will continue to monitor developments in the Middle East, bond yields, oil prices, and the US Dollar. If the US Dollar Index remains above 102.00 and bond yields record a daily gain, Gold will struggle to maintain bullish momentum. In the medium term, higher inflation rates could result in an October rate hike and potentially weaken Gold prices. Key Takeaways: Russia-Ukraine Ceasefire: Prospects of a ceasefire remain a key factor influencing global market sentiment. Corporate Earnings: Upcoming earnings reports could drive stock market volatility and influence investor confidence. Fed & Inflation: Stabilising inflation strengthens expectations that the Federal Reserve will keep interest rates unchanged in October. Middle East Tensions: Escalating geopolitical tensions raise concerns over oil supply disruptions and increased market uncertainty. [B]Always trade with strict risk management. Your capital is the single most important aspect of your trading business.[/B] [B]Please note that times displayed based on local time zone and are from time of writing this report.[/B] Click [URL='https://www.hfm.com/hf/en/trading-tools/economic-calendar.html'][B]HERE[/B][/URL] to access the full HFM Economic calendar. Want to learn to trade and analyse the markets? Join our webinars and get analysis and trading ideas combined with better understanding of how markets work. Click [URL='https://www.hfm.com/en/trading-tools/trading-webinars.html'][B]HERE[/B][/URL] to register for FREE! [URL='https://analysis.hfm.com/'][B]Click HERE to READ more Market news.[/B][/URL] [B]Michalis Efthymiou HFMarkets[/B] [B]Disclaimer:[/B] This material is provided as a general marketing communication for information purposes only and does not constitute an independent investment research. Nothing in this communication contains, or should be considered as containing, an investment advice or an investment recommendation or a solicitation for the purpose of buying or selling of any financial instrument. All information provided is gathered from reputable sources and any information containing an indication of past performance is not a guarantee or reliable indicator of future performance. Users acknowledge that any investment in Leveraged Products is characterized by a certain degree of uncertainty and that any investment of this nature involves a high level of risk for which the users are solely responsible and liable. We assume no liability for any loss arising from any investment made based on the information provided in this communication. This communication must not be reproduced or further distributed without our prior written permission. -
Market Technical Analysis by RoboForex
RBFX Support replied to RBFX Support's topic in Technical Analysis
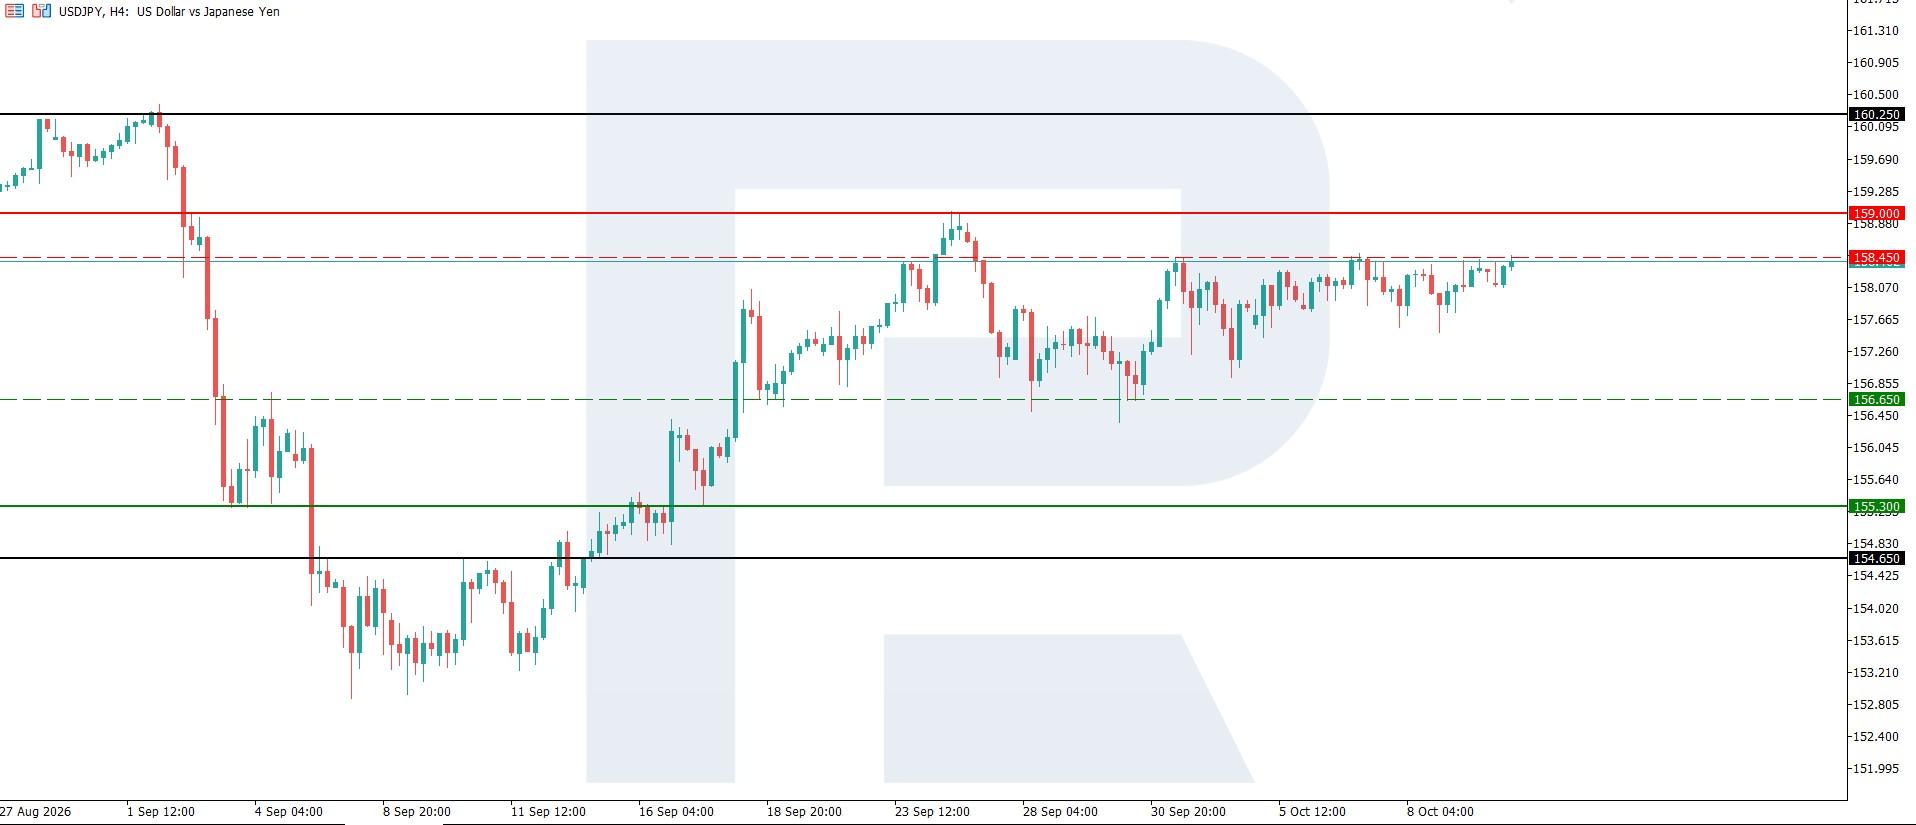
USDJPY poised to extend its gains in line with the broader trend The USDJPY pair retains upside potential amid a record rise in government bond yields, with the rate currently standing at 158.40. Technical outlook On the H4 chart, the USDJPY pair has formed resistance at 158.45, while the nearest support lies around 156.65. On the daily D1 timeframe, the key support level is located at 155.30, with resistance near 159.00. The broader trend remains bullish, although the price is currently consolidating within a sideways range. In the short term, the USDJPY pair retains the potential for further gains, bolstered by a strong US dollar and the substantial interest rate differential between the US and Japan. Read more - USDJPY Forecast Attention! Forecasts presented in this section only reflect the author’s private opinion and should not be considered as guidance for trading. RoboForex bears no responsibility for trading results based on trading recommendations described in these analytical reviews. Sincerely, The RoboForex Team
-
 ceejhay joined the community
 -

James Dalton: Live Markets Seminar - Shadow Trader
⭐ gadfly replied to a topic in Learning Resources
I just shared it in the VIP Vault "Forex" section..... https://indo-investasi.com/forum/256-forex-education-for-vip/ -
Welcome to Indo-Investasi.com. Please feel free to browse around and get to know the others. If you have any questions please don't hesitate to ask.
-
 scorpionin joined the community
 -
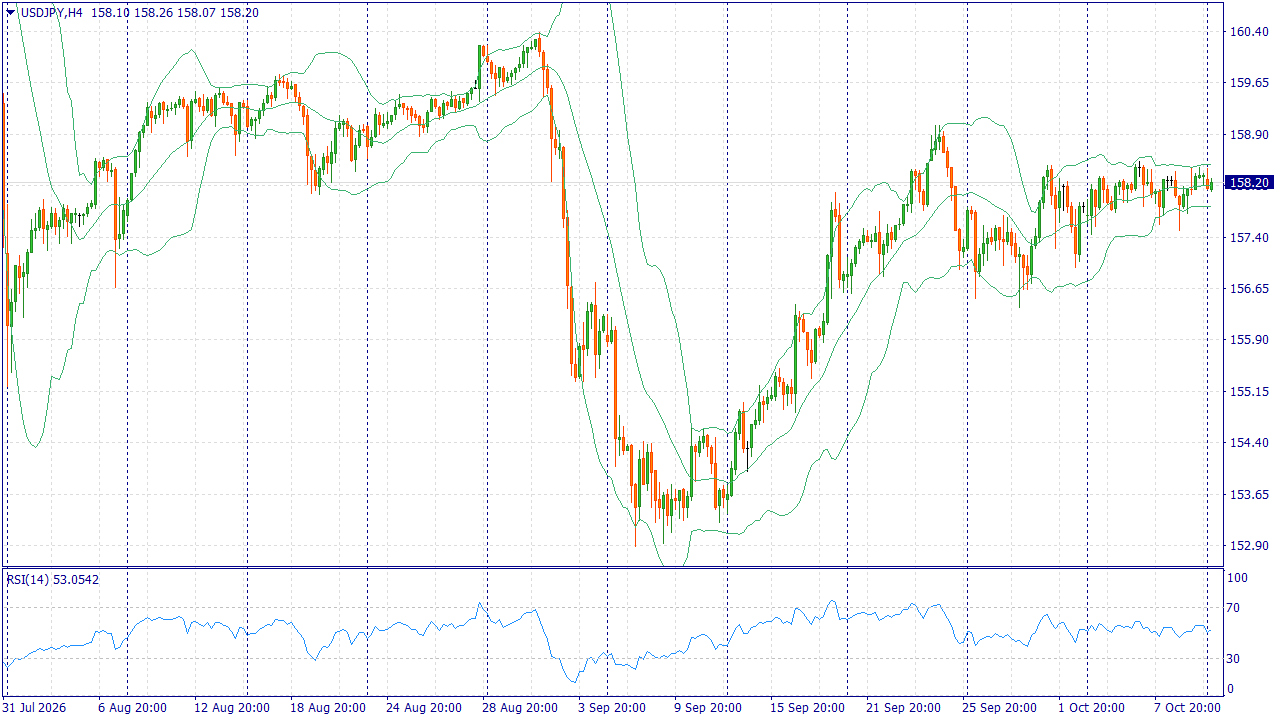
Fundamental Market Analysis for October 12, 2026 USDJPY USDJPY: $25 for a risk-free start! Register, complete verification, enter promo code INDOINVEST10 in your Personal Area, and get a trading bonus with no deposit required. After raising the rate to 1.25% in September, the Bank of Japan remains on a path of policy tightening. Expectations of another hike by year-end support the yen, although the dollar's interest advantage persists. Japanese markets are closed today for a holiday, so reduced liquidity may amplify the currency's reaction to external news without changes in the domestic economic picture. The decline in oil prices at the start of the week potentially eases Japan's energy import costs. This is a favorable factor for the yen, while for the dollar, reduced energy pressure diminishes the urgency for further Federal Reserve tightening. In the current session, this combination allows for a reduction in demand for dollar positions, but it does not itself prove a reversal of US monetary policy. High yields on US assets limit the scope for a bearish USDJPY idea. A resumption of oil price growth could again worsen the yen's position, and the risk of action by Japanese authorities cannot be considered confirmed intervention. With a calmer energy backdrop, expectations of a Japanese rate hike provide grounds for moderate yen strengthening. Trading idea: SELL 158.20, SL 158.50, TP 157.60 Up to $20 per lot with real funds - get guaranteed income by joining the promotion Cashback! You can find more analytical information on our website.
- Last week
-
Welcome to Indo-Investasi.com. Please feel free to browse around and get to know the others. If you have any questions please don't hesitate to ask.