⤴️-Paid Ad- Check advertising disclaimer here. Add your banner here.🔥

Azazel
⭐ V.I.P.-
Posts
336 -
Joined
-
Last visited
-
Days Won
36
Content Type
Profiles
Forums
Articles
Everything posted by Azazel
-
Forecast indexes and stocks whit seasonality.
⭐ Azazel replied to ⭐ Atomo12345's topic in Trading Platforms
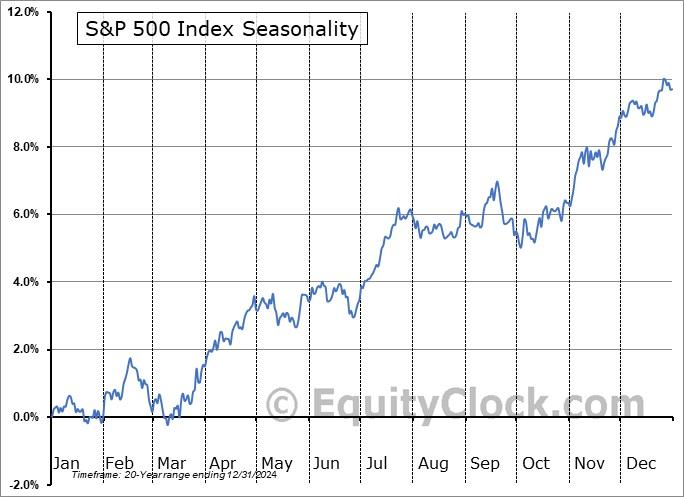
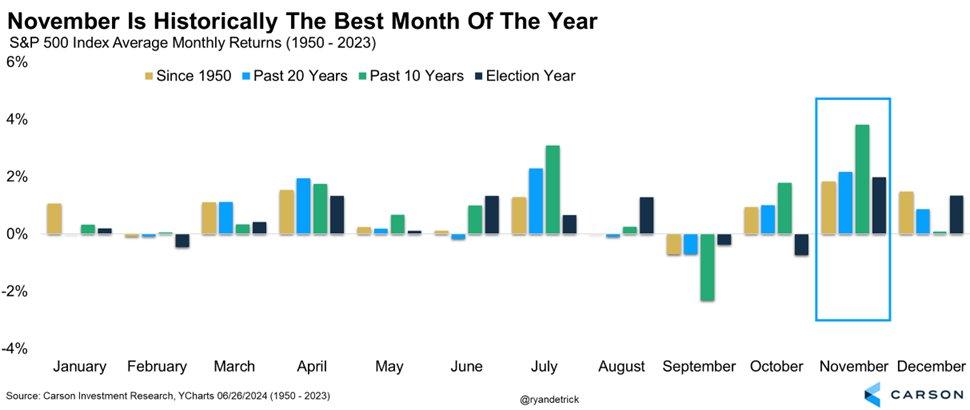
A site specializing in Seasonality (Indices, Commodities, Forex, etc,.,...): https://equityclock.com/charts/ https://charts.equityclock.com/sp-500-index-seasonal-chart -
Forecast indexes and stocks whit seasonality.
⭐ Azazel replied to ⭐ Atomo12345's topic in Trading Platforms
It would be interesting if someone could "educate" this Unger Academy software (by Andrea Unger, 4-time World Trading Champion) for the study of seasonality in Markets: Seasonality & Biases in Trading: How to Leverage Them Effectively! https://www.youtube.com/watch?v=GW4xRuSA_vc -
Here is the updated list from Consob (the Italian Financial Markets Authority, practically corresponding to the U.S. SEC: Securities and Exchange Commission), of various brokers and websites that are offering investment, financial, banking and insurance without the required authorizations, also reported by foreign supervisory Authorities: https://www.consob.it/web/area-pubblica/avvisi-ai-risparmiatori/ultime archives can be searched here: https://www.consob.it/web/area-pubblica/avvisi-ai-risparmiatori?viewId=ultime_com_tutela
- 10 replies
-
- binary option
- scam
-
(and 5 more)
Tagged with:
-
Enquiry on this footprint chart criteria
⭐ Azazel replied to dmyy3k's topic in Trading Systems and Strategies
You can send a PM to Traderbeauty (Moderator): https://indo-investasi.com/profile/85831-traderbeauty/ -
-
-
Forecast 2024 S&P index - pls add on
⭐ Azazel replied to dmyy3k's topic in Trading Systems and Strategies
-
In this video, Andrea Unger (4-time World Trading Champion) explains the scammers' techniques: you start with a very low capital $250, which "miraculously multiply easily", but then...you fail to withdraw the money earned, and finally the fake law firm...: This Trading Scam is Ripping You Off! https://www.youtube.com/watch?v=jjRskintbI0
- 10 replies
-
- binary option
- scam
-
(and 5 more)
Tagged with:
-
It is also important to avoid scams, which unfortunately abound in Trading. This video is by Andrea Unger (4-time World Trading Champion): This Trading Scam is Ripping You Off! https://www.youtube.com/watch?v=jjRskintbI0
-
The greater the leverage, the faster you will burn through your account, especially for those just starting out. For those just starting out and trading, it is important to gain experience and especially to have a statistically profitable strategy, so it pays to trade in simulation (or paper trading) at first, but avoid leverage because you risk burning your account quickly. Even successful traders such as Mark Minervini, Oliver Kell, Kristjan Qullamaggie (see video below), etc.., burned their accounts in the beginning, precisely because experience is needed and trading successfully is not easy. P.S: Your friend advised you well, that Broker that allows 1:3000 leverage is not a reliable Broker, in fact in Europe with CFDs a maximum leverage of 1:30 is allowed. Mark Minervini https://youtu.be/W5ljClz4H3g Kristjan Qullamaggie: https://www.youtube.com/watch?v=WswZwmr2ebU Oliver Kell (2020 US Champion Trader): https://www.youtube.com/watch?v=ltXlF8Z0WFg
-
I downloaded right now the file from pCloud and I did a test with Virustotal which detected: 22 Antivirus out of 67 verified that this file is malicious: AbleTrend 7.08 RT (ablesys.com).zip (see image): https://postimg.cc/bZ14H11n Perhaps this file you uploaded is the same one in which a trojan had already been reported: https://indo-investasi.com/topic/78809-share-abletrend-708-rt-ablesyscom/?do=findComment&comment=561158&_rid=143510 https://indo-investasi.com/topic/78809-share-abletrend-708-rt-ablesyscom/?do=findComment&comment=566001&_rid=143510
-
The file has been blocked by Mediafire because it is dangerous (see image): https://postimg.cc/wtnznmz9 you try a test with virustotal: https://www.virustotal.com/gui/
-
If you can upload the file to: Mega, Mediafire or pCloud, because I have tried several times, with Firefox, MS Edge, Opera and Midori, but the link to sendspace does not work, clicking on: Download an error message appears or you get here: https://www.adsupplyadshost.com/g24/asdefault-smokey6102024.html Thanks a lot.
-
This news is....crazy: this CEO of a Kansas bank was sentenced to 24 years in prison because he caused the bank to fail by causing the loss of $47 million he had sent to cryptocurrency wallets controlled by fraudsters: https://www.nbcnews.com/business/business-news/cryptocurrency-pig-butchering-scam-wrecks-kansas-bank-sends-ex-ceo-pri-rcna167642
- 10 replies
-
- binary option
- scam
-
(and 5 more)
Tagged with:
-
Free historical data from around the World
⭐ Azazel replied to ⭐ Azazel's topic in Learning Resources
You can download these Commodities (all in Metastock format) here: https://www.mediafire.com/file/gk8s32gyq34u790/Natural_Gas_-_Platinum.rar/file Natural Gas cont--NYMEX (2003 - 2018) E-mini Natural Gas cont--NYMEX (2002 - 2018) Platinum (1980 - 2018) Platinum cont--NYMEX (1995 - 2018) -
Here is a list of blocked scams and someone even already convicted: https://www.tradingschools.org/?s=fraud+busted The pattern is always the same: get rich quick, with an algorithm or secret techniques finally revealed, fancy sports cars and beautiful women.....but there is yet another trick: after the scammers have....disappeared with the money, sometimes...they come back and appear as lawyers from law firms promising to be able to recover lost money and instead...they are still the same scammers.... The cat and the fox.
- 10 replies
-
- binary option
- scam
-
(and 5 more)
Tagged with:
-
One should already have a history of intraday data and then update it manually, however, it is a bit....engaging.
-
Hello, excellent presentation. In my view, as you have surely noticed, this Forum has a unique feature, because here we can find and exchange material related to trading, without the limitations found in other Forums. This is the most important feature that we all hope will remain. P.S. Several people have asked if it would be possible to find someone experienced in "educating" some programs; it would also be helpful to find someone experienced in programming with MQL, Easylanguage, etc.....
-
To overcome the blockades imposed by some Countries, you can use one of these solutions (post #24): /forum/forex-forum/forex-e-books-trading-magazines/e-books-palace/810811-updated-regulary-rare-books-and-trading-systems?p=811085#post811085
-
If it is helpful, several financial scams are detailed on this Site, and some of these protagonists have already been arrested and convicted: https://www.tradingschools.org/?s=fraud+busted
-
Michael S. Jenkins Personal Seminars
⭐ Azazel replied to Bill Bundle's topic in General Discussions and Lounge
If it is helpful, here is a 6-hour video by Michael S. Jenkins: /forum/forex-forum/forex-clips-and-movie-tutorial/9326-?p=650426#post650426 -
Larry Williams Special Presentation: Bull or Bear Market? Originally aired as a StockCharts members exclusive on March 25th, now available to everyone:
-
Michael S. Jenkins' video can also be downloaded from mediafire (see post #60): /forum/forex-forum/forex-clips-and-movie-tutorial/9326-?p=650426#post650426
-
Jared Wesley - Live Traders – Technical Stock Trading
⭐ Azazel replied to a topic in Forex Clips & Movies
Here are 8 videos: /forum/forex-forum/forex-clips-and-movie-tutorial/forex-clips-movie-tutorial-request/34791-?p=809152#post809152 -
Merry Christmas and Happy New Year
⭐ Azazel replied to logicgate's topic in General Discussions and Lounge
Happy New Year! https://postimg.cc/DWkP7t11


