⤴️-Paid Ad- Check advertising disclaimer here. Add your banner here.🔥

logicgate
-
Posts
1,511 -
Joined
-
Last visited
-
Days Won
100
Content Type
Profiles
Forums
Articles
Everything posted by logicgate
-
Sure, we have a higher high, higher low, higher close, EvR, but would you have bought it? Probably not... It looks negative, with a close below 50% of range, you would expect next bar to be a down bar.
-
https://www.investopedia.com/terms/b/blocktrade.asp https://finance.yahoo.com/news/block-trade-002326076.html As I said, does not really matter to whom a 1000 (or whatever value) consolidated order belongs, the size is what matters.
-
No. the retail orders clutter all the time and sales with 1 and 2 lots, you can see a gazillion orders happening at the same time, at the same second, even if you have tall monitors, with time sales configured with a small font showing like 70 rows of orders, sometimes the whole screen gets filled with 1 lot orders happening at the same second, same thing when retail stops get hit, you see those flurries of hundreds of 1 lot orders going at the same second, so this is not correct. I am a day trader, don´t consider 10 point and 20 point trades "scalps"... You can apply the same study to higher timeframe bars, it will consolidate big orders and sum them in the same bar. I also use the cumulative delta, so the consolidated orders is a nice addition, cumulative delta is a different reading that takes in consideration the whole bid and ask volume, unfiltered.
-
If you can´t see the full image above, you have to either press ctrl and "-" (minus) on the keyboard to zoom out, or right click and choose to open image in a new tab.
-
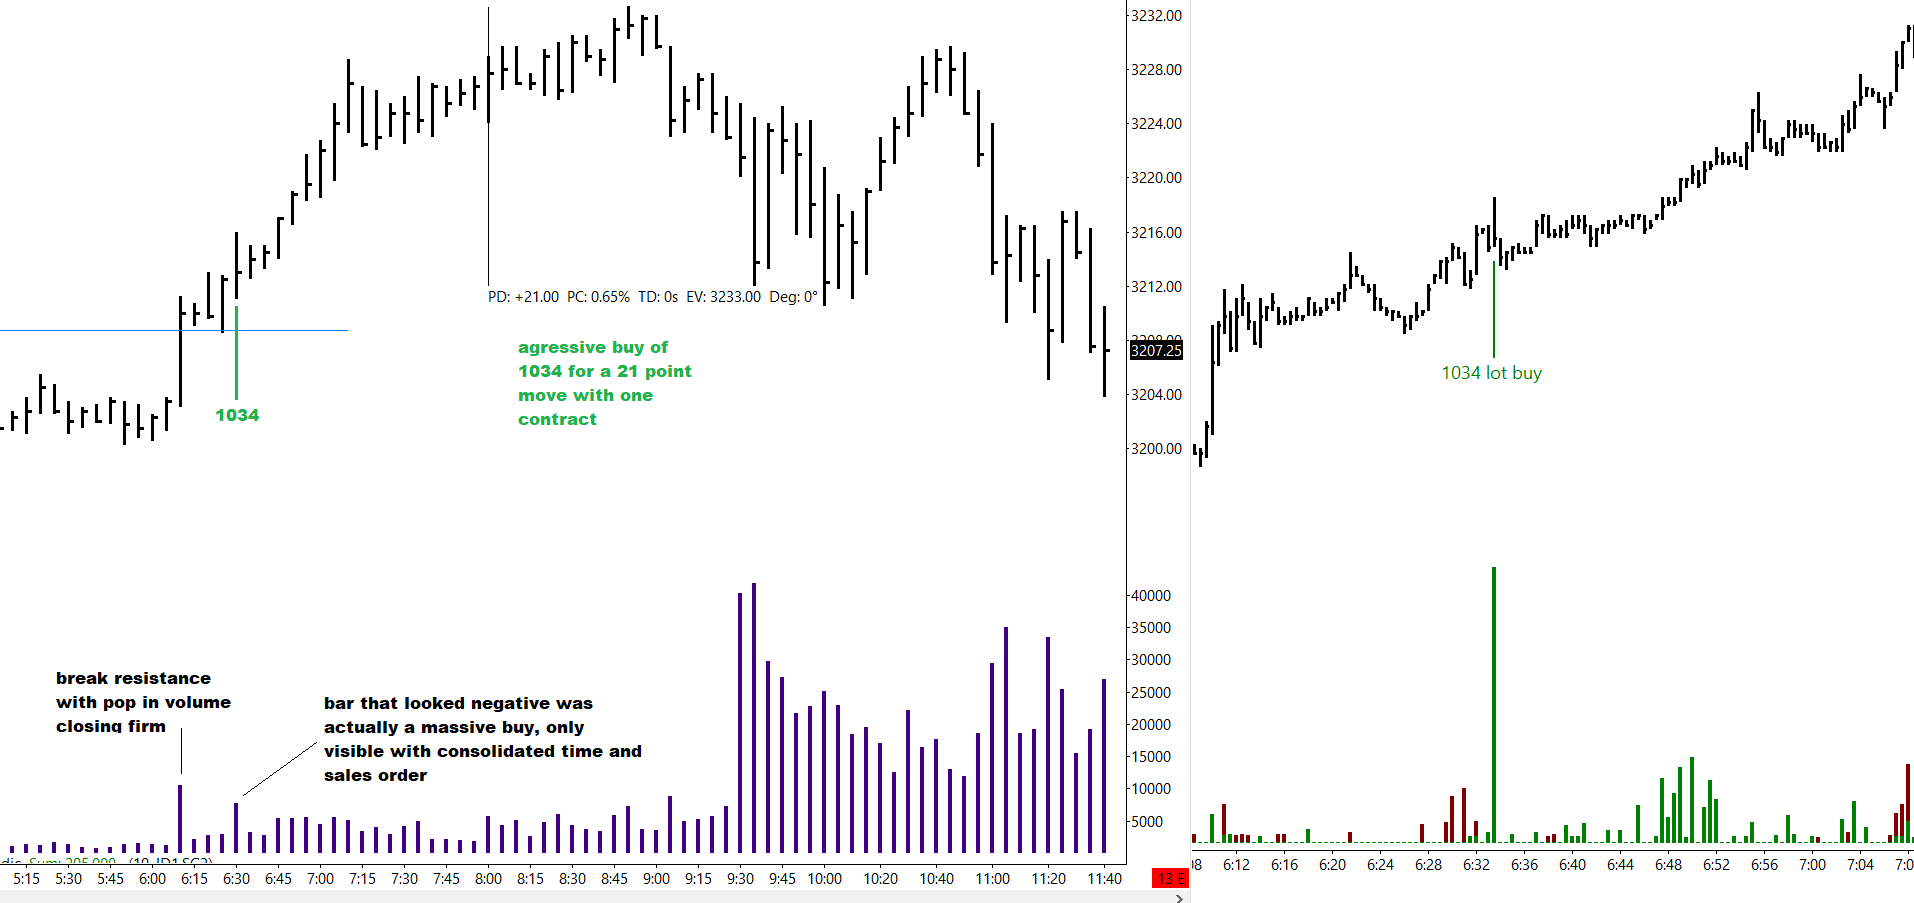
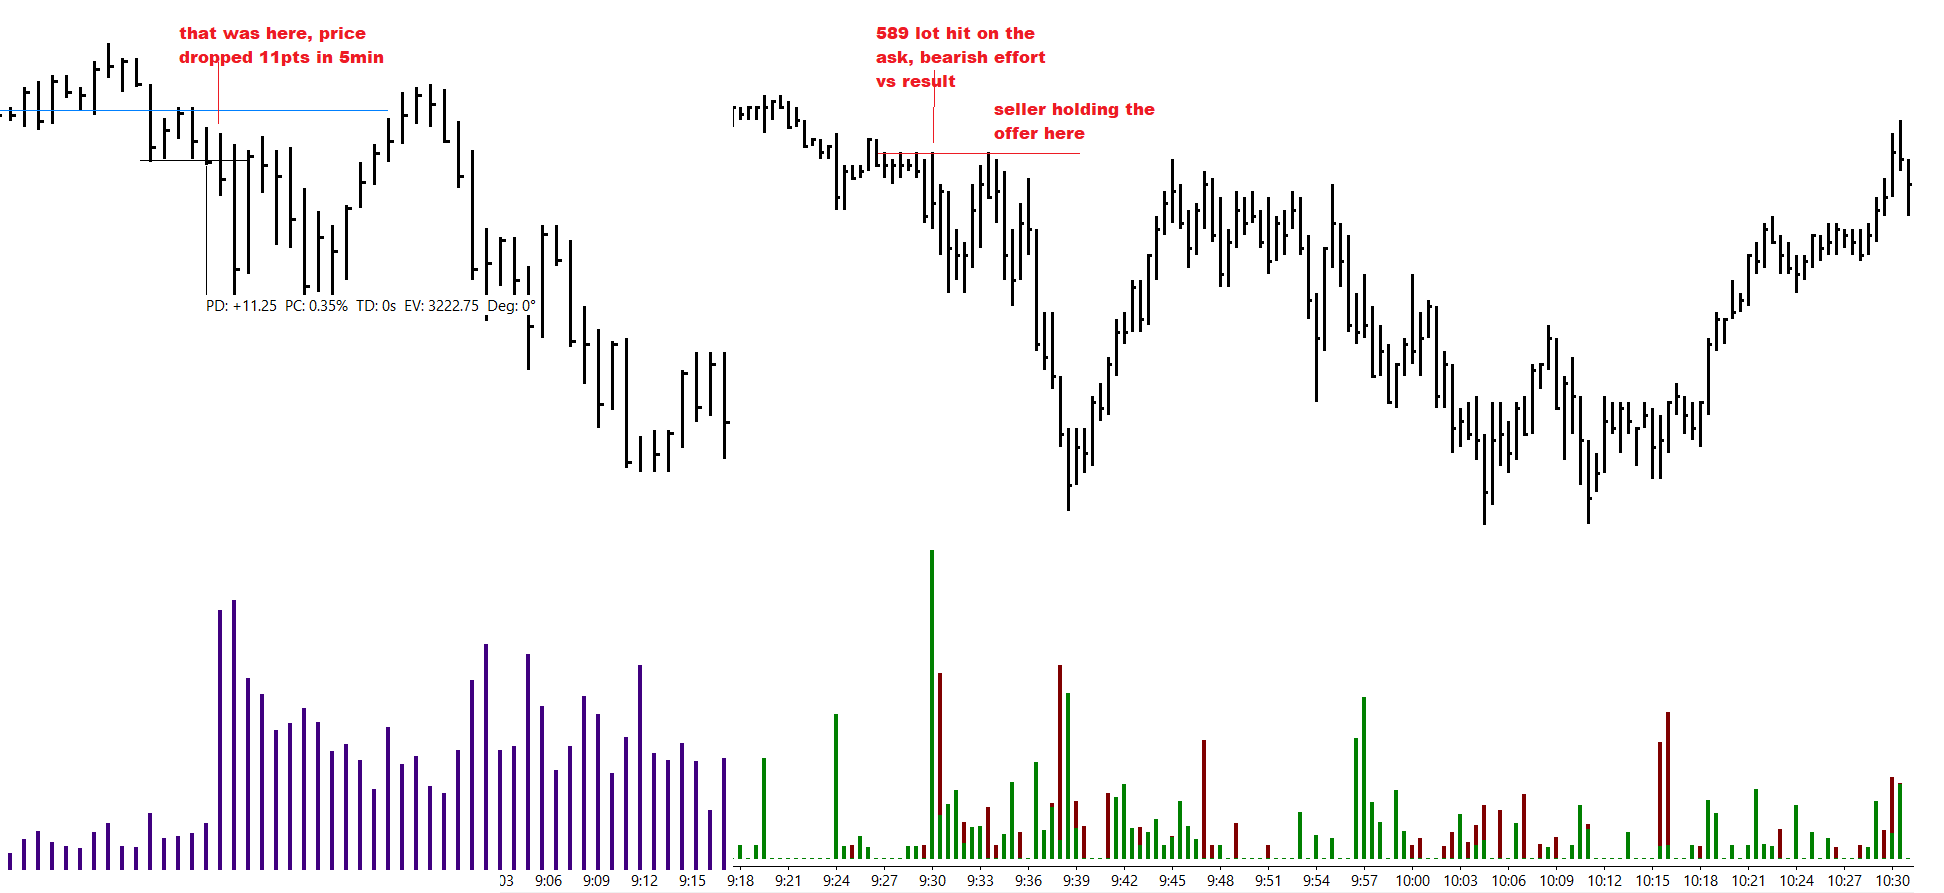
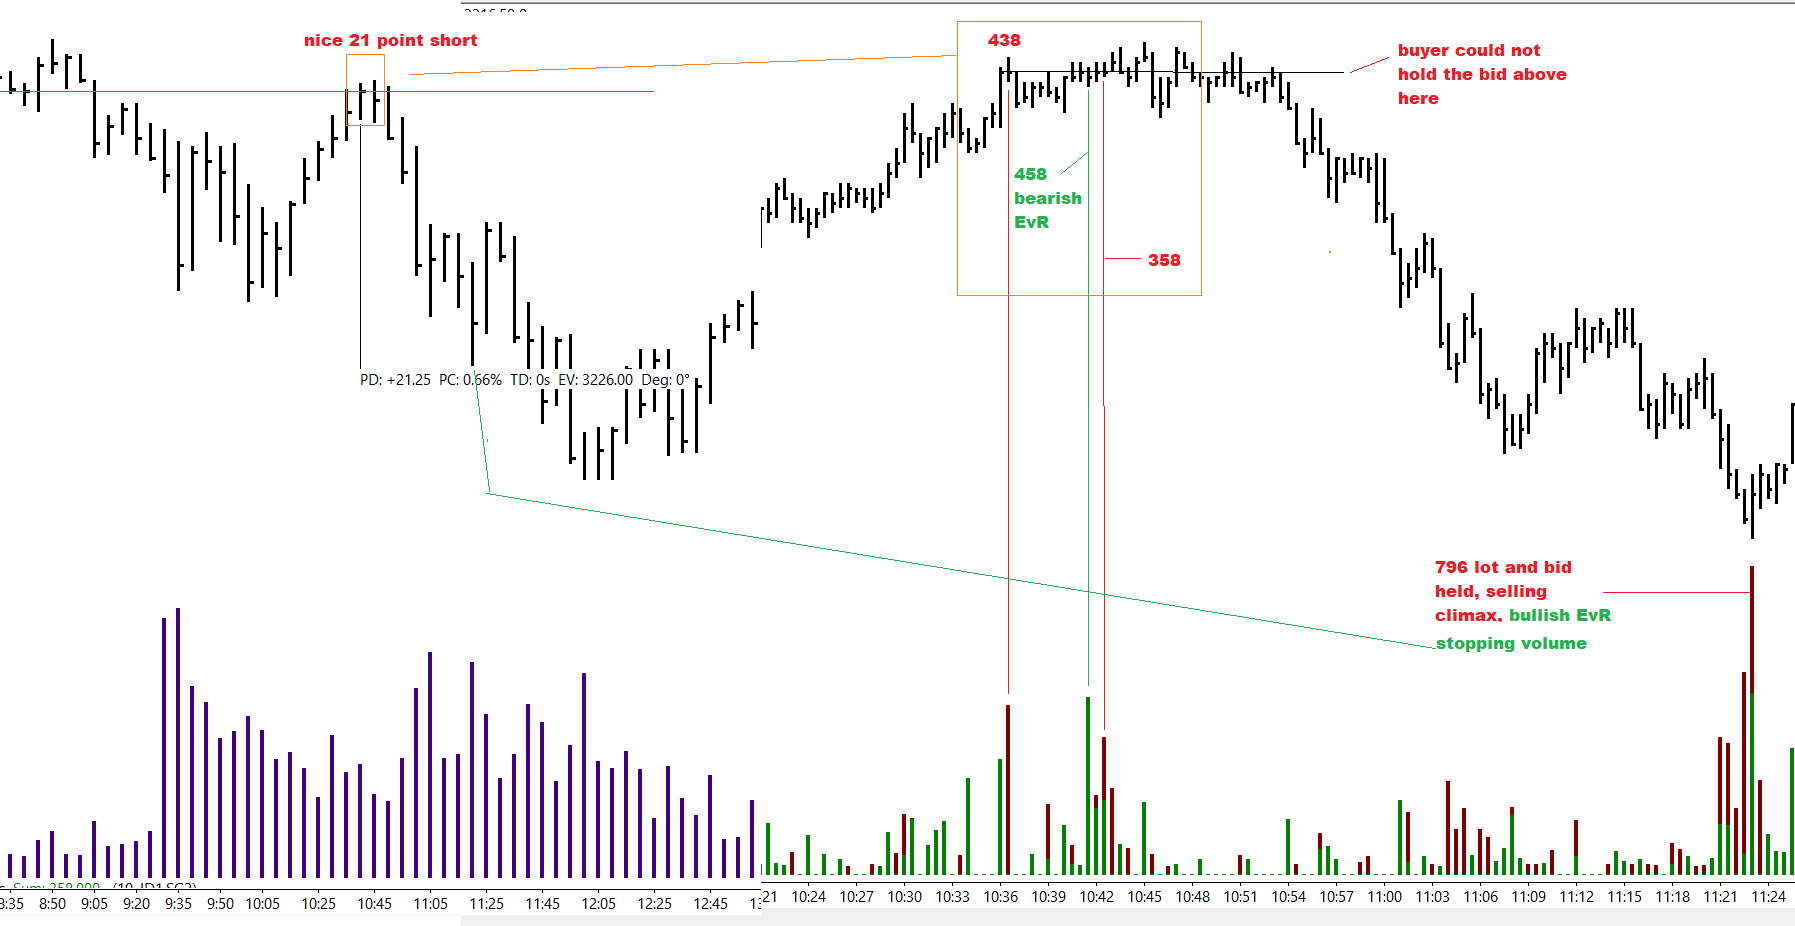
Just a little sample of only one day - this happens all the time. In the first image the consolidated time and sales orders showed a 1034 consolidated buy that happened inside 30 seconds, market went up 21 pts after that. In second image (a little bit later on the same day), price started rolling over after that up move, broke the demand line of the uptrend channel, big seller was holding the offer (clearly visible on the 30 seconds chart), then we a got a 589 buy order in a bar that almost looked like an upthrust, closing very weak = bearish EvR, two chances to short, one at the bar the other a couple of minutes later when the offer held again with no demand, for a 11 points down move in 5 min. 3rd image (also later in the same day), shows seller hitting the market at previous area of weakness, we get a consolidated sell of 1.254 lot (438 + 358 + 458 (this was a massive bearish EvR, so here you consider it a sell, was totally absorbed), for a nice 21 points short. There were even more examples later in the day, and this happens almost every day, but hey, it doesn´t work and I don´t know how to read it :))

-
It is more than good enough to merge orders this way and it works as expected, because in the end, it doesn´t matter if you are consolidating orders of institutions mixed with retail traders, what is gonna matter is the imbalance of supply and demand, and judging the effort vs result of them. I can set the consolidation period for 10 seconds, 20 seconds, 30 seconds, it seems you did not understand how the indicator works. It seems that you don´t know that block trades are made by institutions... No such thing as block trades of retail traders. And they break them up to mask the size, even then the size is not the average 1-5 lot Joe. Even if they are fired through different brokerage firms, they have to be executed almost at the same time, and as I said, you can adjust the interval of consolidation and grab them. Anyways, they always stick like a sore thumb if you know what to look for.
-
This will show you the total volume of the bar, but not the bid and ask volume separately, and also it won´t be filtered.
-
the average retail trader operates 1 to 5 lots, anything over 30 is already a medium to large trader.. LOL yeah right, because everyone has the deep pockets to open a 683 lot position :))... And that is just the example on the image, usually when the large trades are reconstructed they go between 1500 and 7000 lot trades... 683 lot = US$341.500 margin just for this trade and US$8.537,50 per tick, very normal haha
-
I don´t think it get any easier than what I am trying to do... But that is what I am looking for, you might be looking for something else.
-
Continuing from previous image:
-
You have to right click the image and open in a new tab so see it full size. Usually the people who ditch and "burn" methods are the people who can´t use them, like this Don guy. Their mentality is "If I can´t use it, nobody else can, it is a lie" Institutions can´t cover their tracks, that is the whole point of VSA, trading in their shadow. IT does not matter if the orders happen between nanoseconds or pico seconds , they will still gonna be merged because they are inside the same second, I can even merge big filtered orders that happen in 2seconds or 20, 30... The only way they can hide their size is using iceberg orders , you can easily see that on the DOM when a price level has just a few orders and on the tape you have a gazillion orders printing at that level, effort vs result.
-
If the orders you say happens in nanoseconds, miliseconds, theu will stil be inside one second where I will be consolidating them in one big order, merging filtered orders that happen inside the same second or more... This here VWAP will never show you.
-
My friend, VWAP is like a moving average on the chart, there is nothing to do with the concept of bid/ask order filtering/aggregation.
-
The VWAP won´t give you the bar where the consolidated big orders happened.
-
No it won´t , it is not the same thing. First you have to be able to filter the orders of certain size, then aggregate the orders that happen inside the same second. The total volume reading (a bar of a regular volume indicator) is totally different from the values you get this way on the tape. I can have a bar with very total low volume on regular volume, but the consolidated filtered order will show a very big buy order there at that bar, for example.
-
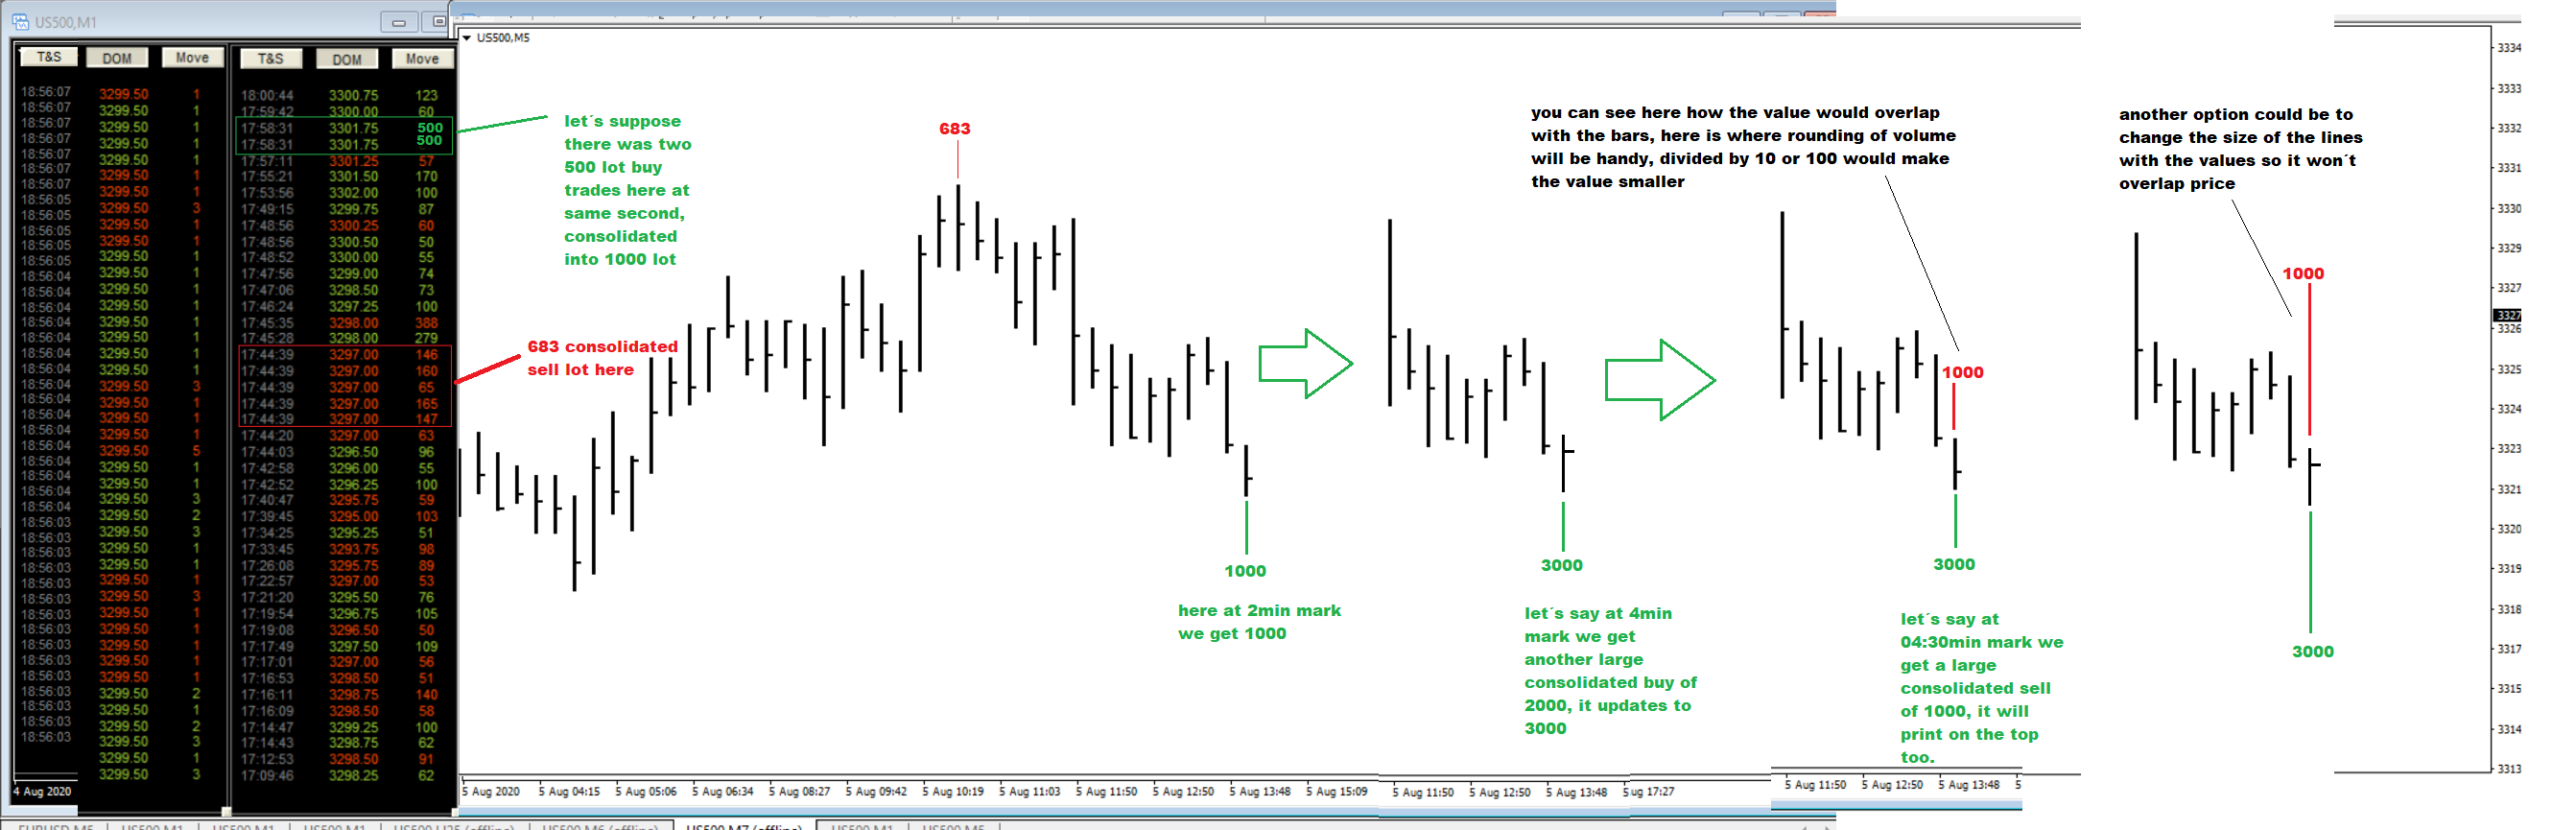
That is the reason why you consolidate the orders in the first place, let´ s say you have 6 orders happening at the same second and they sum up to 2000, 20 seconds later you have another burst summing 1000 lots, and 1min later you have another burst with 1500, so in less than 5min you already have a consolidated order of 4500 lots, which you can only see clearly by merging the orders that happen inside the same second or a bit more, or even in 1minute. Depending on the market you have to adjust the filter size and order consolidation time interval for that market, but you can only do that by watching time and sales to see what is normal and what is anomaly.
-
I hired a programmer to code a study for me, for Sierra, that will do it and then plot on the chart, on the respective bar, the size of the consolidated order. I can customize the filter and the time interval for consolidation (1 second, 2, 5, 10, etc..). For example, if I get a consolidated buy order of 1000 lots, this value will appear in green below the bar. If this is a 5min bar, if another consolidate big order happen before the bar completes, let´s say 2000, then it updates the value to 3000.
-
That is why you consolidate filtered orders. Those algos usually buy/sell in bursts, you can see on the tape all the orders that happen in the same second (or 2, 3 seconds), most of them even happening in the same price. Just consolidate the orders to "reconstruct". Very easy to see the big 1000 + lots trades (talking about the ES). Last week in a small narrow trading range, in the same second there was big consolidated order of 3000 lots on the ask, no surprise price could not get lower and broke to the upside, at that time. You can see those orders sticking out like a sore thumb. Open two time and sales window, configure one to show only orders from 1 to 29 lots and to consolidate the ones that happen at the same second, and the other to show only orders above 29 lots and to consolidate the ones that happen at same second.
-

Tape reading - How to read the tape for day trading
logicgate replied to traderon's topic in Forex Clips & Movies
Torrent completed, reuped the course here: https://ufile.io/vqf3thf5 -
The Price Action Room - 10 Day Tape Reading Mini-Mentorship
logicgate replied to logicgate's topic in Forex Clips & Movies
https://ufile.io/kzonkxoj https://transferxl.com/067Tfp6mgQDXw https://we.tl/t-snLYsd0c3m- 17 replies
-
- 11
-

-
The Price Action Room - 10 Day Tape Reading Mini-Mentorship
logicgate replied to logicgate's topic in Forex Clips & Movies
Ok I downloaded the file and I have no clue why it compressed only one video if I had compressed a whole folder. Reuploading now. -
The Price Action Room - 10 Day Tape Reading Mini-Mentorship
logicgate replied to logicgate's topic in Forex Clips & Movies
nope, 4 videos -
The Price Action Room - 10 Day Tape Reading Mini-Mentorship
logicgate replied to logicgate's topic in Forex Clips & Movies
The size is less than 2GB actually, I reencoded the videos to m4v -
Price Action Room - Tape Reading Mini-Mentorship WEBRip | English | AVI | 1024 x 768 | AVC ~445 Kbps | 30 fps PCM | 352.8 Kbps | 22.05 KHz | 1 channel | 24:03:17 | 7.98 GB Genre: eLearning Video / Trading, Stock Topics covered in the recording: - Platform setup - if it isn't done right, you're going to miss the most important information streaming into your tradestation. - A thorough, hands-on discussion of how to read the order flow on your Time & Sales window. - Wish you could break away from lagging indicators? We'll show you how! - See how to correlate the tape back to your DOM and charts. - Price action trading from a chart? Learn how to confirm YOUR chart setups with the tape. - Stuck in the destructive cycle of SIM trading? We're going to show you how to develop the confidence to trade real money. - Learn how to deal with damaging emotions such as fear and greed. - Wish you knew how to manage your trades? Find out numerous professional strategies. - Still don't have a trading plan? We're going to discuss numerous facets of a professional trader's action plan. - Learn how to track the market manipulators and large traders using only your DOM and Time & Sales. - Bonus! Learn how High Frequency Traders are operating in your instruments, and how you must adapt to compete with them. GET: https://ufile.io/1pww1f92
- 17 replies
-
- 21
-
-
Tape reading - How to read the tape for day trading
logicgate replied to traderon's topic in Forex Clips & Movies
I found a torrent for this, let´s see if it completes, then I reup here.