
⤴️-Paid Ad- Check advertising disclaimer here. Add your banner here.🔥
Leaderboard


Popular Content
Showing content with the highest reputation on 10/09/2026 in all areas
-

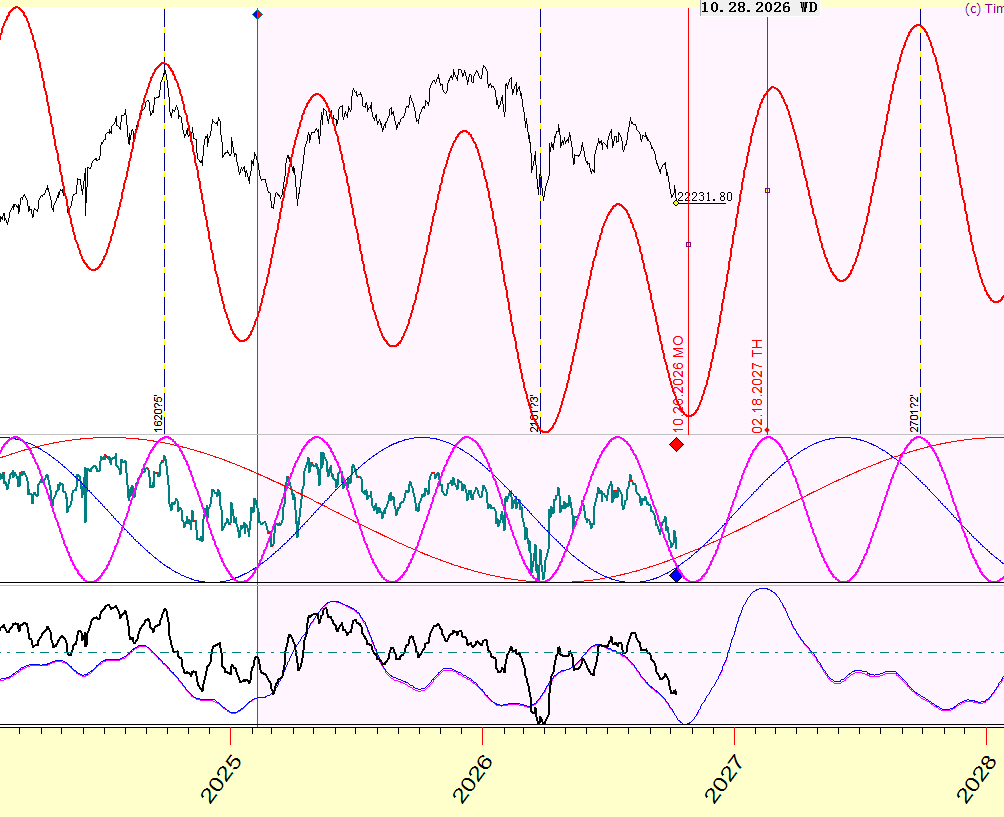
Timingsolution & Nifty Updates - 3
Sergiy23 and one other reacted to ⭐ banker2882 for a topic
hxxps://workupload.com/file/bN4nUpEAQZQ2 points -
Timingsolution & Nifty Updates - 3
⭐ RichardGere reacted to ⭐ banker2882 for a topic
I don't trade Nifty; I just did a quick analysis 1 point
 -

Timingsolution & Nifty Updates - 3
⭐ kesk reacted to ⭐ RichardGere for a topic
I don't trade Nifty and this is the first time I am seeing a Nifty chart. A little surprised that it has many price gaps. I have traded Chart Patterns about 15 years ago and was only mildly successful. But this chart is interesting. Here are my comments purely from a Chart Pattern trading point of view. PLEASE NOTE THAT I AM NOT AN EXPERT NOR DO I CLAIM TO BE. THE FOLLOWING ARE JUST MY COMMENTS. The Double Bottom (DB) is still in a pending state as the price can go down further although it appears to have reached a S&D zone. It is a M shaped DB instead of a W shaped DB. Increases the possibilities of some Harmonic Patterns forming that will provide some confluence for the turning point. If the price does go down lower than the left trough and then goes up again and then form another pivot, it shows possibility of stop loss and sell stop hunting. (liquidity sweep?). This shows the possibility of Smart Money is in play and increases the possibility of Smart Money will bring the price up. The last downward wave shows a possible Elliott Wave 5 wave Impulse. Wave 5 of this 5 wave Impulse also shows that it has its internal 5 wave near completion (5 wave of 5). To test the completion of Wave 5, you can check (using the daily chart) if there is a divergence between price and indicator, possibly using an ElliottWave Osc or any Oscillator ie Stochastic. Because of the existence of this 5 wave Impulse wave, it might be preferable to trade from a Elliott Wave methodology while having the knowledge that Double Bottom is providing some support to the price movement. If Harmonic pattern is also detected, it increases the potential of a possible reversal. If Wave 5 is deemed to have completed (via a divergence), trader may choose to enter (per AdancedGET style), a Linear Regression channel is plotted for the last wave. Enter when price crosses over the Linear Regression upper band. To find tune entry, go to the H4 or H1 to enter. This reduces the risk and increase the R:R SL is set as below the trough and 1xR is calculated from SL to Entry (on Daily chart). Money and risk management is dependent of the trader's personal preference.1 point -

Timingsolution & Nifty Updates - 3
Sergiy23 reacted to ⭐ ahmed ibrahim for a topic
thanks, waiting for banker2882 completion1 point -
https://mega.nz/file/qcIRjJBJ#a4a6yMqLkGfVBNIgUDB6u4phjKWejWF_pdZ9nATN9uk 04 Oct 2026 Terra updater. Needs a fix for AI/Terra menus.1 point
-
https://mega.nz/file/udZl3YyA#roCr-yUSEcMT1l0hD5y3yfMAgOTX4kbj0KL9i127LaQ Timing Solution Advanced 29 Sep 2026 version ONLY. Not the usual Terra update. Don't have access to this now and once gain access, possibly will resume it.1 point