All Activity
- Past hour
-
I'm looking for the Autotrader ANYONE? https://workupload.com/file/SPG8EAtp4Kb Thanks
- Today
-
 hybrid76 reacted to a post in a topic:
dimensiontrader.com (request)
hybrid76 reacted to a post in a topic:
dimensiontrader.com (request)
-
 hybrid76 reacted to a post in a topic:
ORB_TradeSaber
hybrid76 reacted to a post in a topic:
ORB_TradeSaber
-
 Kumar joined the community
 -
⭐ RichardGere reacted to a post in a topic:
ninjastrategyloader.com
-
ampf reacted to a post in a topic:
ninjastrategyloader.com
-
Thank you @apmoo for your doing this
-
Minerva reacted to a post in a topic:
Timingsolution & Nifty Updates - 3
-
 AgusGBU joined the community
 -
 ALE_00_ joined the community
 -
⭐ QuBit reacted to a post in a topic:
twoleggedpullback.com
-
garban reacted to a post in a topic:
LegendaryTrader Indicator and Strategy
-
⭐ klhk reacted to a post in a topic:
ORB_TradeSaber
-
⭐ klhk reacted to a post in a topic:
harmonytradingsystem.com [Request]
-
⭐ klhk reacted to a post in a topic:
harmonytradingsystem.com [Request]
-
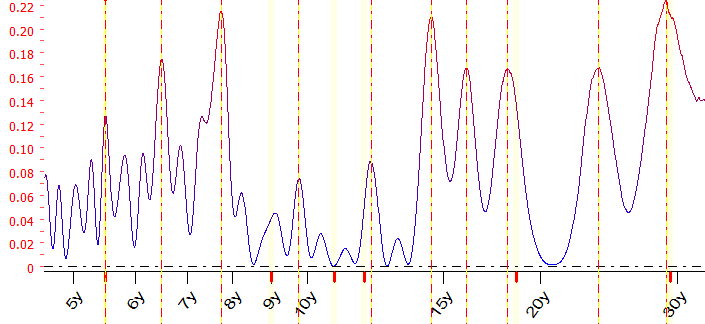
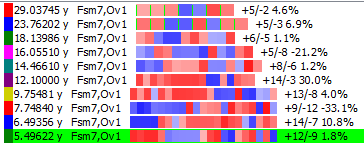
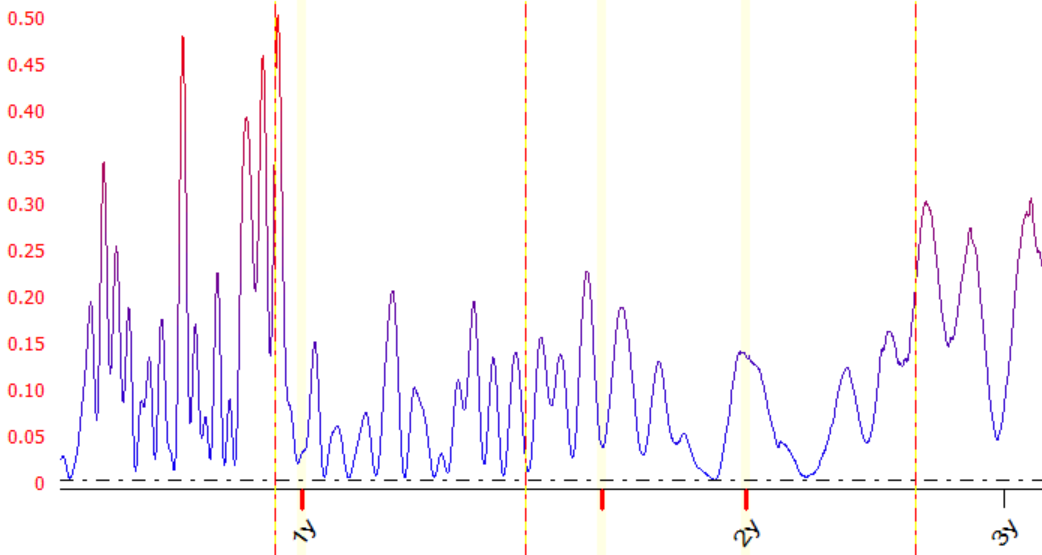
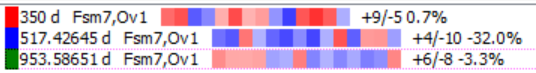
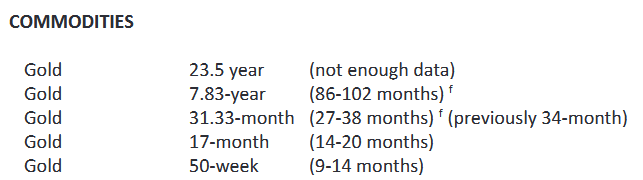
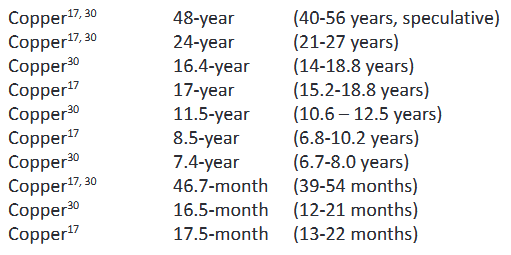
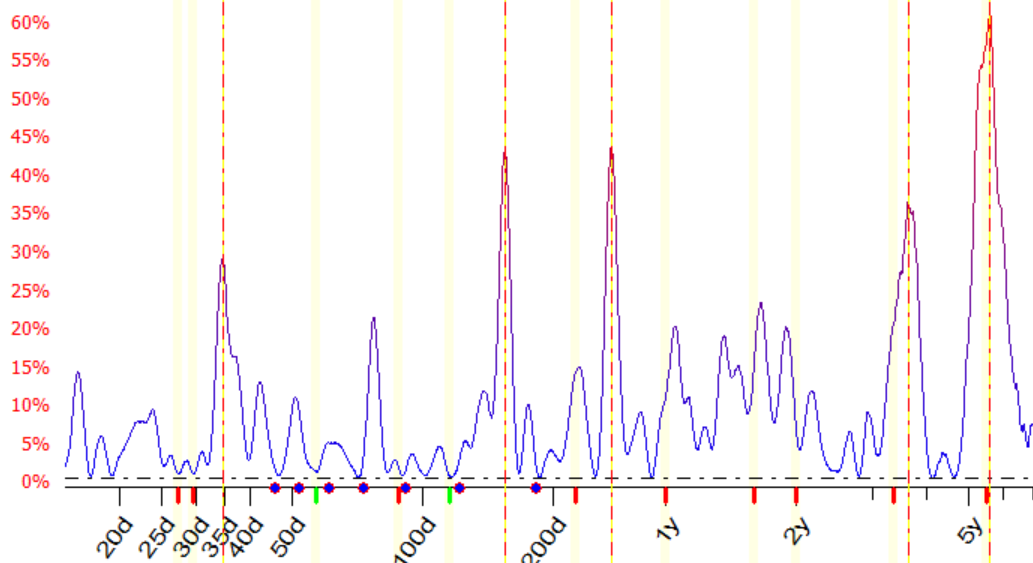
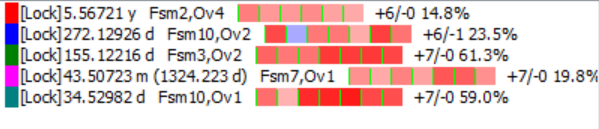
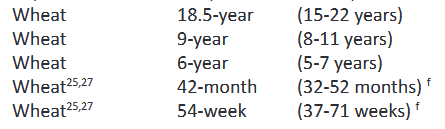
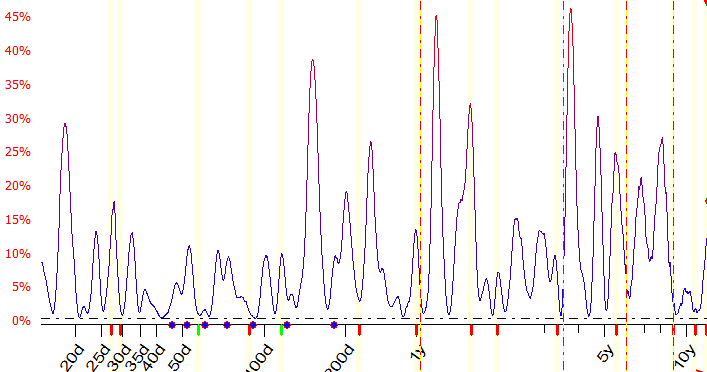
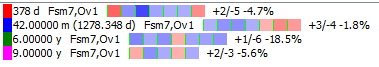
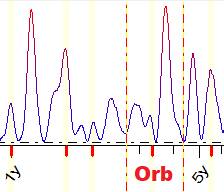
Yes sadly this is the same old story about Gann. The life long quest for holy grail which will keep the reader buying more cryptic magic puzzle books and courses for rest of his life. Thank you, I think you answered the question about Gann and why this so called 'best trader' should be avoided. Now for Ray and his Orb theory (cycle length can fluctuate with 1/6th range)... it is true cycle can fluctuate but I also call this trading book authors perfect "large margin for error" Ok, let's test his research about cycles. I think the orb theory should become apparent. Let us check his Gold cycles first, since it is the current most hyped bull market asset. First we will check medium term daily Gold data 1975 until 2025, we will look for his cycles < 3 years. You see there is many cycles detected. I choose only Ray's cycles. None of this shows consistent, correlated cycle to Gold price. Maybe his first 50 week cycle (350d) exist with 9 win and 5 loss, but will you trade this 0.7% correlation 🤣 Let's also check long term Gold cycles, I have monthly gold data from 1790 until 2025, so 235 years data. I see 7.74y cycle, maybe it is within the Orb (7.16y - 8.5y) from Rays expected 7.83y cycle, but it is also poor quality and currently inverted negative cycle. Do you really want to trade based on 'static cycle from a book' with 9 win and 12 loss ? Maybe the 12.1 year Gold cycle is strongest. Why this is not in Ray's book list ? ---------------------------- Ok, let us also check Copper, since I know it has better cycles then Gold. In fact, trading Gold is really a dumb idea in my opinion since the Gold cycle are highly variable compared to other assets. Here is Ray's list. I have medium term data for Copper, daily from 1988 until 2025. It is enough to test his first cycles. I put Rays cycles, not very good if you simply use static cycle in a book. How about if we also tune the amount of overtone and backtest period on Rays cycle, to improve Sorry, still not very good. Reader paying attention might notice 46.7m is within "Orb" large margin for error (39m to 54m), but others are totally useless and there is much better cycle we can find ourself. How about instead we just use recommendation by Timing Solution for Copper. Of course 34d/155d is very good, but it is of course not even in this experts book. Why is this? Because short cycle is best for trading, but short cycle will soon expire so it cannot be used to sell your book. ---------------------------- I will give one last example for Rays book list. Here is Wheat. I use medium term daily data, 1972 until 2025. I really do not know what this author is talking about. These are poor quality cycle. Do you also see how many other cycle peak is detected "within Orb" 32m-52m (2.6y-4.3) range. Orb shows many possible cycles. Many possible excuses. Give me a break. Here is my Wheat cycle. 44.8m (within 32m-52m large Orb margin for error from Rays book list). It is better then most of his other 'recommendation' but I will still not trade with such weak 9% price correlation. Maybe you prefer my cycle, 62% price correlation. Maybe I shall sell some books, like Ray and Gann, instead of trading 🙂 and when I make mistake and want margin for error, I will invent term, such as Orb so you will not sue me.

-
In the past this was hard i can look again
-
Yes i tried it, but unfortunately not working
-
Have you tried the free one from Ninza.Co, their Bid-Ask Display indicator that works for time-based or non time-based chart.
-
I think this will be good to help confirm trades https://www.ninjastrategyloader.com/turning-point-indicator/ https://www.ninjastrategyloader.com/nsl-market-depth-order-flow-for-ninjatrader-8/ https://www.ninjastrategyloader.com/nslriskmanager/ @apmoo Can you help here? Thank you NSL_Market_Depth_Order_Flow.zip NSL_Trade_Exit_Manager.zip Turning_Points_Indicator.zip
-
Hi Does any please has this renko price indicator which can work on any renko bars type, i have many but they work only on regular renko bars or unirenko. Thanks
-
-
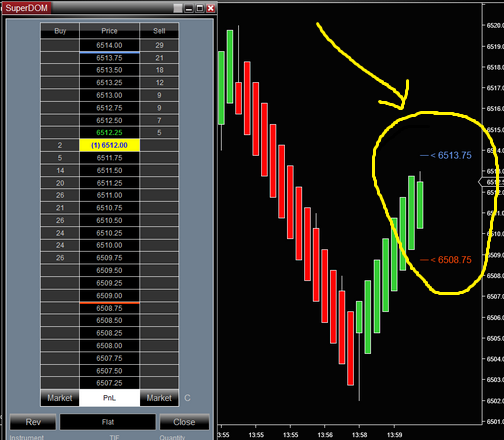
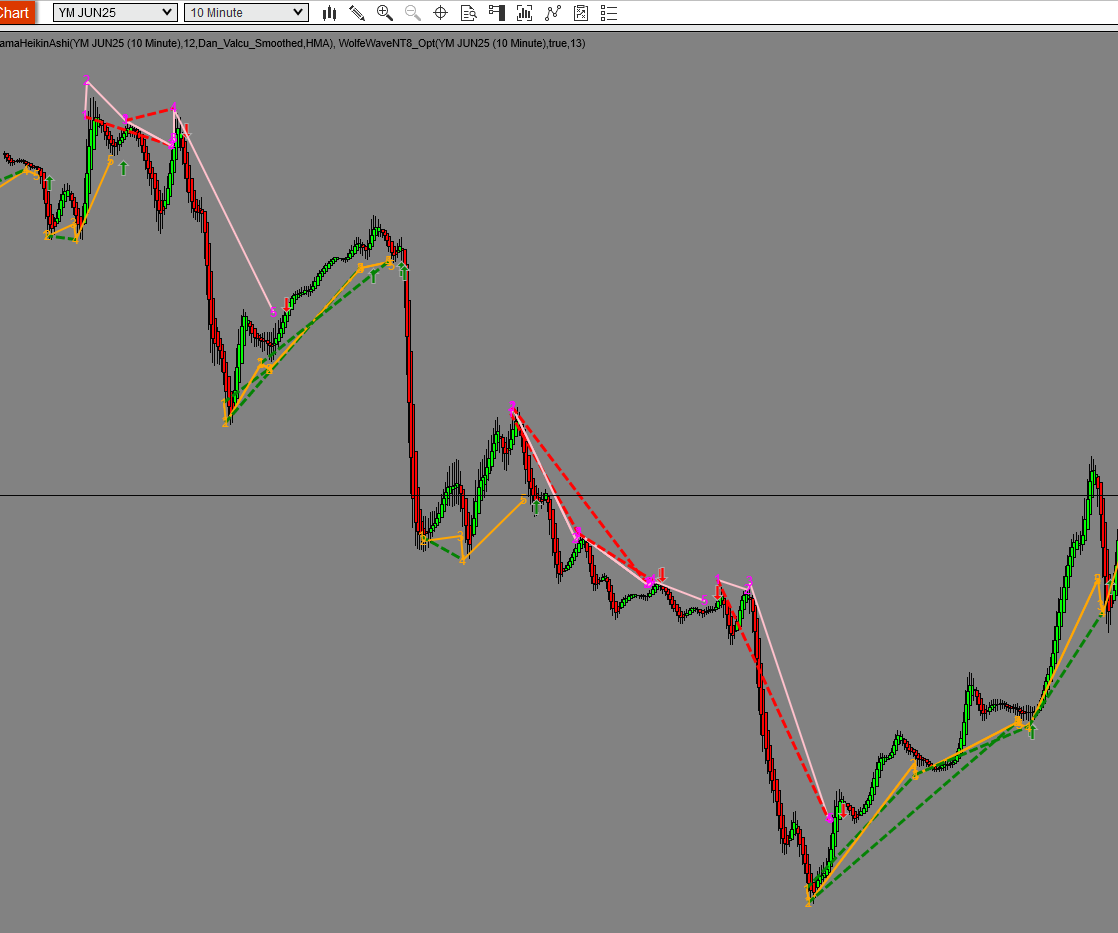
Hello, here is the first BETA release from Convert. Could you send me a screenshot of how it looks in ThinkorSwim? #region Using declarations using System; using System.Collections.Generic; using System.ComponentModel; using System.ComponentModel.DataAnnotations; using System.Linq; using System.Text; using System.Threading.Tasks; using System.Windows; using System.Windows.Input; using System.Windows.Media; using System.Xml.Serialization; using NinjaTrader.Cbi; using NinjaTrader.Gui; using NinjaTrader.Gui.Chart; using NinjaTrader.Gui.SuperDom; using NinjaTrader.Gui.Tools; using NinjaTrader.Data; using NinjaTrader.NinjaScript; using NinjaTrader.Core.FloatingPoint; using NinjaTrader.NinjaScript.DrawingTools; using NinjaTrader.NinjaScript.Indicators; #endregion namespace NinjaTrader.NinjaScript.Indicators { public class WolfeWaveNT8_Opt : Indicator { [Range(2, 50), NinjaScriptProperty] public int WaveLength { get; set; } = 13; [NinjaScriptProperty] public bool LabelPoints { get; set; } = true; private struct Extremum { public int BarIndex; public double Price; } private List<Extremum> swingHighs = new List<Extremum>(); private List<Extremum> swingLows = new List<Extremum>(); private int lastBullPatternBar = -1; private int lastBearPatternBar = -1; protected override void OnStateChange() { if (State == State.SetDefaults) { Name = "WolfeWaveNT8_Opt"; IsOverlay = true; Description = "Wolfe Wave para NinjaTrader 8 - optimizado"; } } protected override void OnBarUpdate() { if (CurrentBar < WaveLength) return; // Detectar máximos y mínimos de swing una sola vez para esta barra if (High[WaveLength / 2] == MAX(High, WaveLength)[WaveLength / 2]) { int idx = CurrentBar - WaveLength / 2; double price = High[WaveLength / 2]; // Evita añadir dos veces el mismo punto (por ejemplo en el primer ciclo) if (swingHighs.Count == 0 || swingHighs[swingHighs.Count - 1].BarIndex != idx) swingHighs.Add(new Extremum() { BarIndex = idx, Price = price }); if (swingHighs.Count > 20) swingHighs.RemoveAt(0); } if (Low[WaveLength / 2] == MIN(Low, WaveLength)[WaveLength / 2]) { int idx = CurrentBar - WaveLength / 2; double price = Low[WaveLength / 2]; if (swingLows.Count == 0 || swingLows[swingLows.Count - 1].BarIndex != idx) swingLows.Add(new Extremum() { BarIndex = idx, Price = price }); if (swingLows.Count > 20) swingLows.RemoveAt(0); } // Wolfe Bullish if (swingLows.Count >= 5) { var pts = swingLows.GetRange(swingLows.Count - 5, 5); // Revisa si este patrón ya se dibujó (no lo repite) if (pts[4].BarIndex != lastBullPatternBar) { // Patrón Wolfe básico: puedes ampliar reglas aquí a gusto if (pts[0].Price < pts[2].Price&&pts[2].Price < pts[4].Price) { string tagBase = "BullWolfe_" + pts[0].BarIndex + "_" + pts[4].BarIndex; // Limpia tags antiguos de este patrón si existen for (int i = 0; i < 5; i++) RemoveDrawObject("BullP" + (i + 1) + "_" + tagBase); for (int i = 0; i < 4; i++) RemoveDrawObject("BullWolfe" + i + "_" + tagBase); RemoveDrawObject("BullTarget" + tagBase); RemoveDrawObject("BullArrow" + tagBase); // Dibuja líneas for (int i = 0; i < 4; i++) { Draw.Line( this, "BullWolfe" + i + "_" + tagBase, false, CurrentBar - pts[i].BarIndex, pts[i].Price, CurrentBar - pts[i + 1].BarIndex, pts[i + 1].Price, Brushes.Orange, DashStyleHelper.Solid, 2 ); } Draw.Line( this, "BullTarget" + tagBase, false, CurrentBar - pts[0].BarIndex, pts[0].Price, CurrentBar - pts[3].BarIndex, pts[3].Price, Brushes.Green, DashStyleHelper.Dash, 3 ); // Puntos y flecha solo si se solicita if (LabelPoints) { for (int i = 0; i < 5; i++) { int barsAgo = CurrentBar - pts[i].BarIndex; Draw.Text( this, "BullP" + (i + 1) + "_" + tagBase, false, (i + 1).ToString(), barsAgo, pts[i].Price - TickSize * 2, 0, Brushes.Orange, new SimpleFont("Arial", 13), TextAlignment.Center, Brushes.Transparent, Brushes.Transparent, 100 ); } // Flecha entrada en p5 Draw.ArrowUp(this, "BullArrow" + tagBase, false, 0, pts[4].Price - TickSize * 2, Brushes.Green); } lastBullPatternBar = pts[4].BarIndex; } } } // Wolfe Bearish if (swingHighs.Count >= 5) { var pts = swingHighs.GetRange(swingHighs.Count - 5, 5); if (pts[4].BarIndex != lastBearPatternBar) { if (pts[0].Price > pts[2].Price&&pts[2].Price > pts[4].Price) { string tagBase = "BearWolfe_" + pts[0].BarIndex + "_" + pts[4].BarIndex; for (int i = 0; i < 5; i++) RemoveDrawObject("BearP" + (i + 1) + "_" + tagBase); for (int i = 0; i < 4; i++) RemoveDrawObject("BearWolfe" + i + "_" + tagBase); RemoveDrawObject("BearTarget" + tagBase); RemoveDrawObject("BearArrow" + tagBase); for (int i = 0; i < 4; i++) { Draw.Line( this, "BearWolfe" + i + "_" + tagBase, false, CurrentBar - pts[i].BarIndex, pts[i].Price, CurrentBar - pts[i + 1].BarIndex, pts[i + 1].Price, Brushes.Pink, DashStyleHelper.Solid, 2 ); } Draw.Line( this, "BearTarget" + tagBase, false, CurrentBar - pts[0].BarIndex, pts[0].Price, CurrentBar - pts[3].BarIndex, pts[3].Price, Brushes.Red, DashStyleHelper.Dash, 3 ); if (LabelPoints) { for (int i = 0; i < 5; i++) { int barsAgo = CurrentBar - pts[i].BarIndex; Draw.Text( this, "BearP" + (i + 1) + "_" + tagBase, false, (i + 1).ToString(), barsAgo, pts[i].Price + TickSize * 2, 0, Brushes.Magenta, new SimpleFont("Arial", 13), TextAlignment.Center, Brushes.Transparent, Brushes.Transparent, 100 ); } Draw.ArrowDown(this, "BearArrow" + tagBase, false, 0, pts[4].Price + TickSize * 2, Brushes.Red); } lastBearPatternBar = pts[4].BarIndex; } } } } } }
-
-

Trader you keep sending me the same dtp quantcycle atch arch im not able at the time. I will see what i can do
-
- Yesterday
-
I mean the indicator ..
-
Could you just use the Fib indicators from ARC. Blue Fib to buy and Red Fib to sell when price hits these lines. Trigger line is free to download from various places, as well as Renko bars. ARC does have good and decent stuff but it really slows down your PCs. Takes quite awhile to load up their indicators. At least in my case, with my crappy PC. Trading Renko bars look wonderful on chart after the fact. All nice and smooth. In real life, it is another story. Plenty of times, it just pops quickly with many bars in a row. You are then late.
-
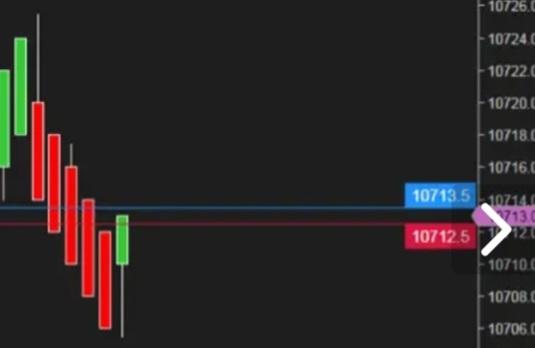
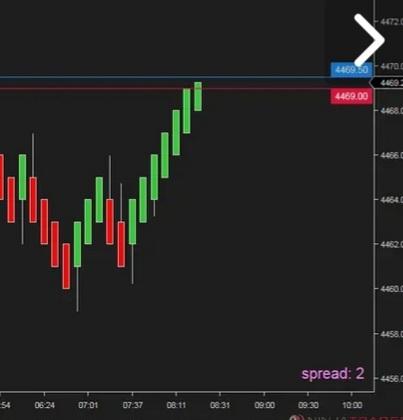
That's because they showed you the setup in the backtesting environment.
-
When you loaded it .. ? It's not shows like the video!!?
-
Nexgen give you free trial for 7 days. Its the best Fib system. https://nexgent3.com/
-
@apmoo lets check it
-
Yeah, I remember. Nexgen and Kwikpop were one of those requested but none was able to.
-
Nexgen never was cracked, I have the installer.
-
This reminds me of many years back, the NexgenT3 system.
-
Here it is, in TOS script, I copy it to a Word document rp_Wolve_Wave.docx
-

HFMarkets (hfm.com): Market analysis services.
AllForexnews replied to AllForexnews's topic in Fundamental Analysis
Date: 25th April 2025. Trade Tensions Hurt Confidence Across Europe Trading Leveraged products is Risky The latest European confidence indicators highlighted the growing impact of global trade tensions on investor sentiment, particularly within the Eurozone. According to recent surveys, investor confidence has been notably dented, with the services sector showing greater weakness compared to manufacturing. This may be due to U.S. efforts to front-load imports ahead of potential tariff hikes. Meanwhile, diverging fiscal policies between the UK and the Eurozone have further widened economic gaps. The UK faces limited fiscal flexibility and mounting pressure to stimulate domestic demand, complicating its response to external shocks. German ZEW Investor Confidence Plummets Germany's ZEW investor sentiment index plunged in April following the announcement of new U.S. tariffs. The index fell by a staggering 65.6 points to -14.0, reflecting growing pessimism about the economic outlook. While recent political shifts offered short-term relief to market sentiment, uncertainty remains elevated, suggesting this key forward-looking indicator may stay in negative territory. Eurozone PMI and Ifo Data Show Mixed Signals Surprisingly, the Eurozone PMI and Germany’s Ifo business climate report showed resilience. Although the composite PMI dropped to a four-month low of 50.1—indicating stagnation rather than contraction—the weakness was concentrated in the services sector. The services PMI fell to 49.7, ending a five-month expansion streak. Germany’s Ifo survey showed improvements in construction and business sentiment, driven by a rise in the current conditions index. The overall business climate index rose to 86.9 in April, up from 86.7 in March, defying expectations of a decline. Trade Boost May Be Temporary as Risks Persist Trade data from February revealed a 22.4% year-over-year jump in Eurozone exports to the U.S., with Ireland’s pharmaceutical-heavy exports surging by 200%. S&P Global noted signs of stockpiling and unplanned orders from U.S. clients trying to stay ahead of tariffs. However, analysts warn this boost may be short-lived. As tariffs bite and the euro strengthens, European exports risk becoming less competitive. Despite hopes that EU goods could benefit from U.S.-China trade disputes, long-term gains are uncertain. If U.S. firms start to run down inventories, demand may soften. Germany and EU Infrastructure Investment to Counter Trade Headwinds Germany’s decision to raise borrowing for infrastructure and defense, alongside EU-wide investment plans, aims to cushion the blow from external shocks. Sentiment in the German construction sector has already improved, according to the Ifo report. While large-scale spending will take time to materialize, early signs show progress in the defense sector. UK PMI Data Signals Growing Economic Challenges Across the Channel, the UK economy is facing multiple headwinds. Government finances are strained, and recent fiscal data missed expectations. Although the UK may enjoy lower tariffs post-Brexit, its open economy is more vulnerable to global slowdowns. Rising labor costs, due to higher National Insurance contributions and minimum wage hikes, have added pressure. The latest S&P Global UK Composite Output Index dropped sharply to 48.2 in April from 51.5, with the Services PMI falling to 48.9—a 27-month low. Manufacturing Output PMI also fell to 44.0, the weakest since mid-2021. S&P Global attributed this decline to weakened client confidence and the impact of U.S. tariffs. Business outlooks have dimmed, with optimism at its lowest since October 2022. Rising cost burdens have prompted employment cuts, and inflationary pressures persist, despite easing energy prices. UK Inflation and Rate Outlook: BoE Faces Tough Decisions The CBI industrial trends survey painted a similarly cautious picture. Although total orders slightly improved, export orders deteriorated. Selling price expectations also rose, reflecting cost pressures. Bank of England Governor Andrew Bailey emphasized risks to growth and warned about the dangers of global economic fragmentation. While markets are pricing in another BoE rate cut, rising wage-driven inflation may keep UK interest rates elevated relative to the Eurozone. Always trade with strict risk management. Your capital is the single most important aspect of your trading business. Please note that times displayed based on local time zone and are from time of writing this report. Click HERE to access the full HFM Economic calendar. Want to learn to trade and analyse the markets? Join our webinars and get analysis and trading ideas combined with better understanding of how markets work. Click HERE to register for FREE! Click HERE to READ more Market news. Andria Pichidi HFMarkets Disclaimer: This material is provided as a general marketing communication for information purposes only and does not constitute an independent investment research. Nothing in this communication contains, or should be considered as containing, an investment advice or an investment recommendation or a solicitation for the purpose of buying or selling of any financial instrument. All information provided is gathered from reputable sources and any information containing an indication of past performance is not a guarantee or reliable indicator of future performance. Users acknowledge that any investment in Leveraged Products is characterized by a certain degree of uncertainty and that any investment of this nature involves a high level of risk for which the users are solely responsible and liable. We assume no liability for any loss arising from any investment made based on the information provided in this communication. This communication must not be reproduced or further distributed without our prior written permission.