⤴️-Paid Ad- Check advertising disclaimer here. Add your banner here.🔥
All Activity
- Past hour
-
This is because of the same old bad guys of trsh four like caticho 😬
-
 Dav reacted to a post in a topic:
Amibroker V7
Dav reacted to a post in a topic:
Amibroker V7
-

HFMarkets (hfm.com): Market analysis services.
AllForexnews replied to AllForexnews's topic in Fundamental Analysis
Date: 7th April 2026. NIKKEI 225 Outlook in 2026. The Japanese NIKKEI 225 has been the best-performing stock market of 2026. Despite difficult market conditions, it has still risen by more than 6%. However, throughout the month of March, while geopolitical conflicts escalated, the NIKKEI 225 was the worst-performing. What does this mean for the Japanese stock market? Why is the NIKKEI 225 the best-performing of 2026? The Japanese NIKKEI 225 trend was primarily supported by strong corporate earnings, a weaker yen boosting export competitiveness, and fiscal changes under a new government. Structural reforms and improved shareholder returns have also enhanced confidence, attracting both domestic and international capital. The new Japanese Prime Minister, Takaichi, is a supporter of fiscal stimulus and a looser policy. For example, the new PM was quick to introduce more tax breaks and restructuring measures aimed at supporting Japanese companies. In addition to this, the new administration further expanded the country's benefits programme, aiming to boost consumer demand and families. As a result, investors were quick to trade the ‘Takaichi Trade’. In addition, relatively stable monetary policy from the Bank of Japan has provided a supportive backdrop compared to more restrictive policies elsewhere. This has helped sustain liquidity and risk appetite, allowing the index to outperform despite global uncertainty and ongoing geopolitical tensions. In 2026, up to the point of the conflict, the NIKKEI 225 had risen almost 20% in a period of less than three months. The Middle East Crisis The Middle East crisis was the pivotal point at which the trend came to an end. Upon the geopolitical sphere deteriorating, the index lost all gains from 2026 and did not find support until reaching the year’s lows. The Japanese stock market saw a larger decline in comparison to other competitors as the country is more reliant on oil imports from the Strait of Hormuz. Whereas US and European countries do not rely on that region to necessarily support energy products. A positive factor for the Japanese stock market in recent days is that Iran has allowed a few Japanese ships to pass through the Strait. Nonetheless, the crisis continues to have a negative impact on the Japanese stock market. What are Analysts Expecting for the NIKKEI 225? HFM - NIKKEI225 8-Hour Chart Analysts remain broadly constructive on the NIKKEI 225, although expectations have become more cautious after its strong rally and the recent rise in geopolitical risk. The outlook will largely depend on how the conflict continues to develop. If the conflict escalates further, the NIKKEI 225 may come under pressure from lower investor sentiment. However, this is something which will be a common issue throughout the global stock market. Under such conditions, the asset will see sell signals strengthen if the price falls below 53,157.60. However, a price above 53,189.00 indicates a bullish outlook based on the 75-period EMA. If the conflict does end with the Strait being reopened, previous projections may again be relevant. A Reuters poll published on 24 February showed a median forecast of 58,500 by the end of 2026. Key Takeaways: The NIKKEI 225 is the best-performing major index of 2026, driven by earnings, a weaker Yen, and pro-growth policies. The rally reversed sharply in March as Middle East tensions escalated, wiping out earlier gains. Japan’s reliance on oil imports via the Strait of Hormuz makes its market more vulnerable to geopolitical shocks. Analysts remain cautiously bullish, but the outlook depends heavily on how the conflict develops. Always trade with strict risk management. Your capital is the single most important aspect of your trading business. Please note that times displayed based on local time zone and are from time of writing this report. Click HERE to access the full HFM Economic calendar. Want to learn to trade and analyse the markets? Join our webinars and get analysis and trading ideas combined with better understanding of how markets work. Click HERE to register for FREE! Click HERE to READ more Market news. Michalis Efthymiou HFMarkets Disclaimer: This material is provided as a general marketing communication for information purposes only and does not constitute an independent investment research. Nothing in this communication contains, or should be considered as containing, an investment advice or an investment recommendation or a solicitation for the purpose of buying or selling of any financial instrument. All information provided is gathered from reputable sources and any information containing an indication of past performance is not a guarantee or reliable indicator of future performance. Users acknowledge that any investment in Leveraged Products is characterized by a certain degree of uncertainty and that any investment of this nature involves a high level of risk for which the users are solely responsible and liable. We assume no liability for any loss arising from any investment made based on the information provided in this communication. This communication must not be reproduced or further distributed without our prior written permission. -
I can't believe he got people to dish out $2.5k for this! Crazy!
-

Market Technical Analysis by RoboForex
RBFX Support replied to RBFX Support's topic in Technical Analysis
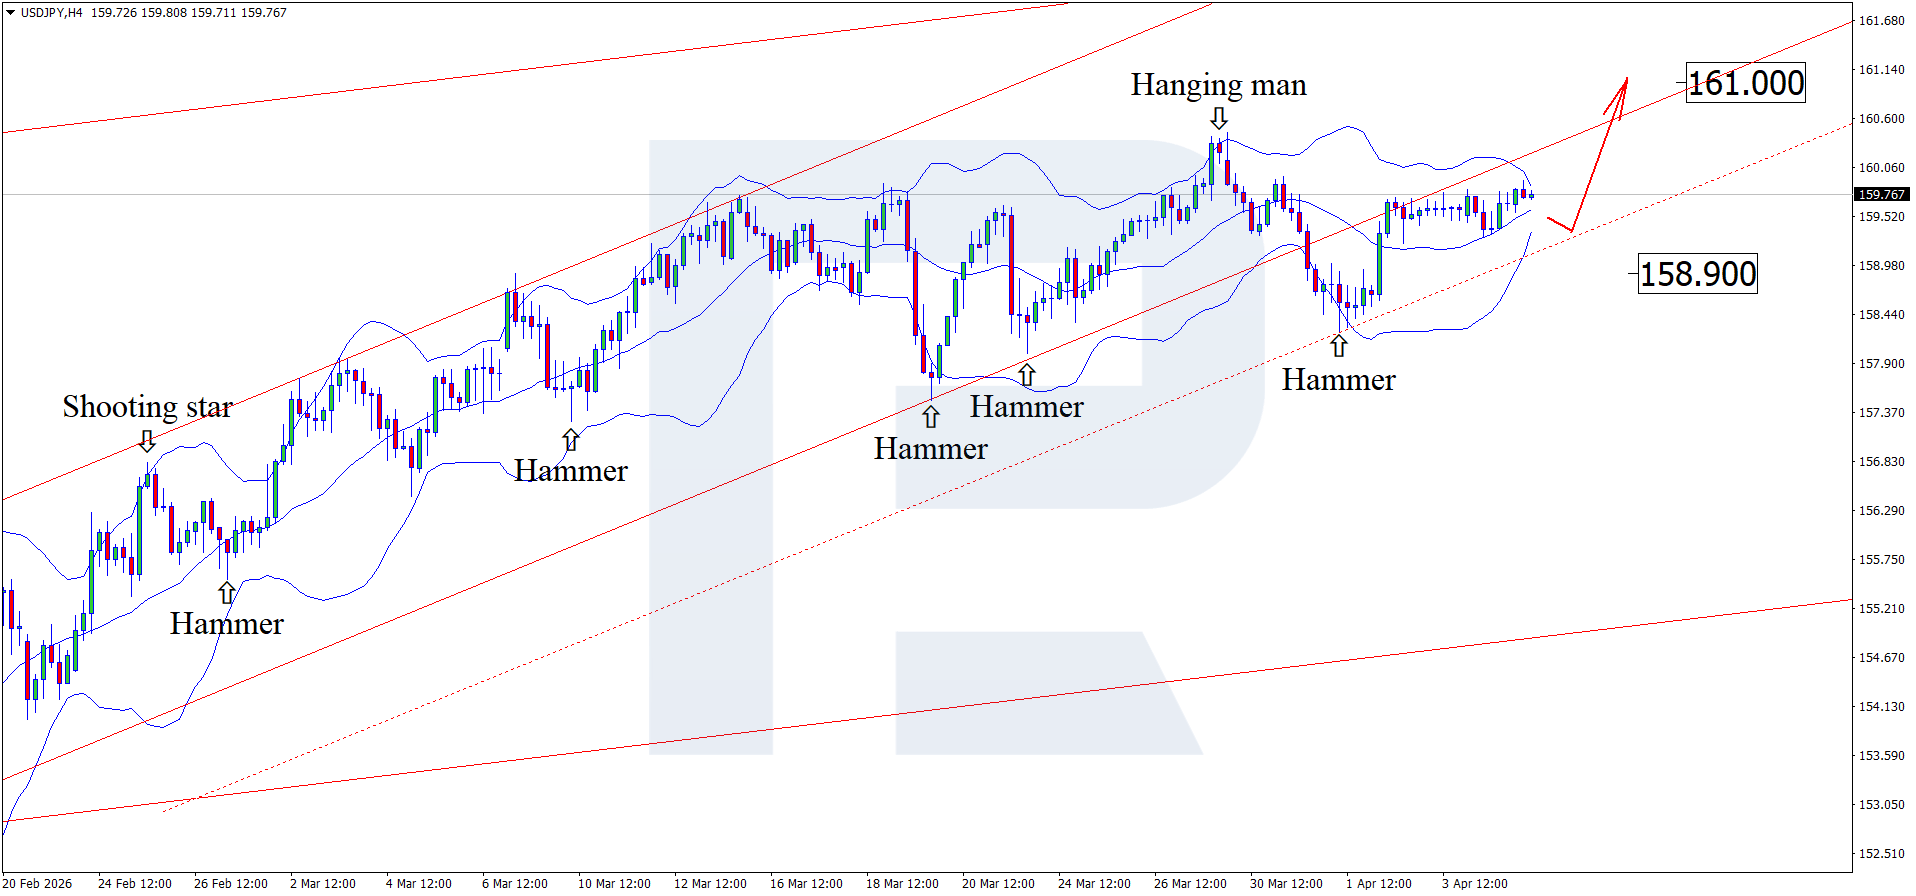
Final countdown for USDJPY: ultimatum, rumours of peace, and the threat of intervention The USDJPY pair is balancing on the edge of a breakout above the 160.00 level and intervention by the Japanese government. Quotes are testing the 159.80 mark. Discover more in our analysis for 7 April 2026. Technical outlook On the H4 chart, the USDJPY pair has formed a Hammer reversal pattern near the lower Bollinger Band and is hovering around 159.70. Since the price remains within an ascending channel, it may break resistance and continue its upward trajectory following the pattern’s signal, with the upside target at 161.00. The USDJPY pair is on the verge of a breakout above 160.00 and intervention by the Japanese government. Read more - USDJPY Forecast Attention! Forecasts presented in this section only reflect the author’s private opinion and should not be considered as guidance for trading. RoboForex bears no responsibility for trading results based on trading recommendations described in these analytical reviews. Sincerely, The RoboForex Team
- Today
-
Here are some resources from Jack Gillen: https://indo-investasi.com/topic/92878-jack-gillen-simplified-astrology-course/?&_rid=143510#findComment-716622
-
how this can pass prop and win more than a month ?
-
 kimsam reacted to a post in a topic:
KimSam NT8 GEX Calc
kimsam reacted to a post in a topic:
KimSam NT8 GEX Calc
-
adonis reacted to a post in a topic:
KISS strategy
-
-
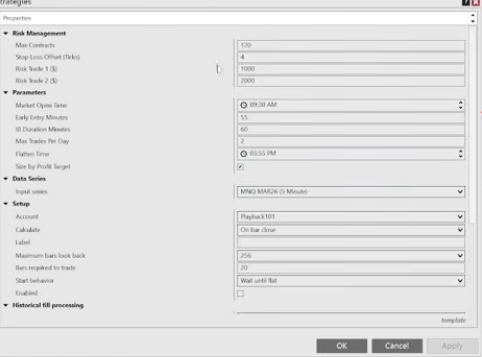
MNQ Settings
-
ynr reacted to a post in a topic:
KISS strategy
-
techfo reacted to a post in a topic:
ERTS (Easy Renko Trading System) Needs Unlocking
-
techfo reacted to a post in a topic:
ScalperIntel IFVG
-
Ninja_On_The_Roof reacted to a post in a topic:
KISS strategy
-
Clue when he said it usually takes 1 trade a day or so around 10.
-
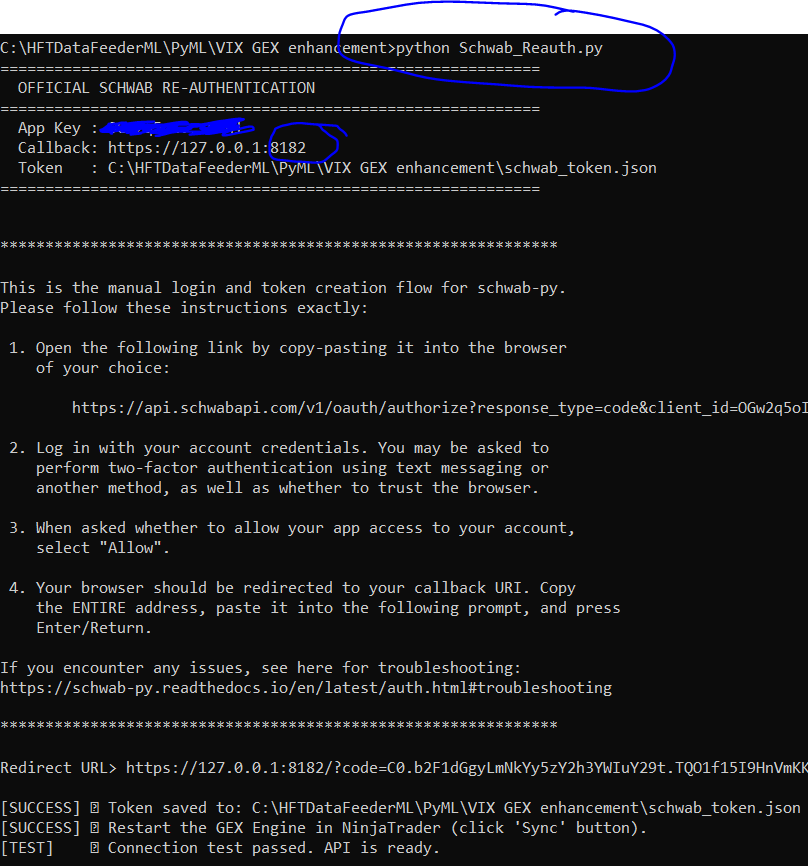
Reauthentication of keys : kimsam has provided a reauth py script, use it. First you have to make sure follow his instructions on setting up the env file with the API key, secret and callback URL. then run the py script without any arguments, it will open a browser to authenticate, once done you will get a redirect failed weblink, copy the url and paste back to the py terminal, it will get authenticated and token will be created. Usually the token good for a week.
-
 techfo reacted to a post in a topic:
N!njacators L!quidity Sweep
techfo reacted to a post in a topic:
N!njacators L!quidity Sweep
-
techfo reacted to a post in a topic:
WOLFE WAVE
-
is anybody able to download the DT Reset Patch? chrome blocks it as virus, then when i allow it, windows removes it even if i say allow on device. edit: nvm. had to disable windows realtime protection. btw, does anybody know DT original website/youtube channel?
-
techfo reacted to a post in a topic:
DT Range Volume Profile
-
Install the python and all packages in the requirements.txt file, Get Schwab API key, secret and ensure the call back url is correct. This one is the difficult of all the things and just follow schwab link and documentation shared by kimsam. Now add the indicator shared by kimsam and ensure the parameters are correctly configured/filled. It will work like a charm. Do do this all some experience with python is required to trouble shoot in case some issue.
- Yesterday
-
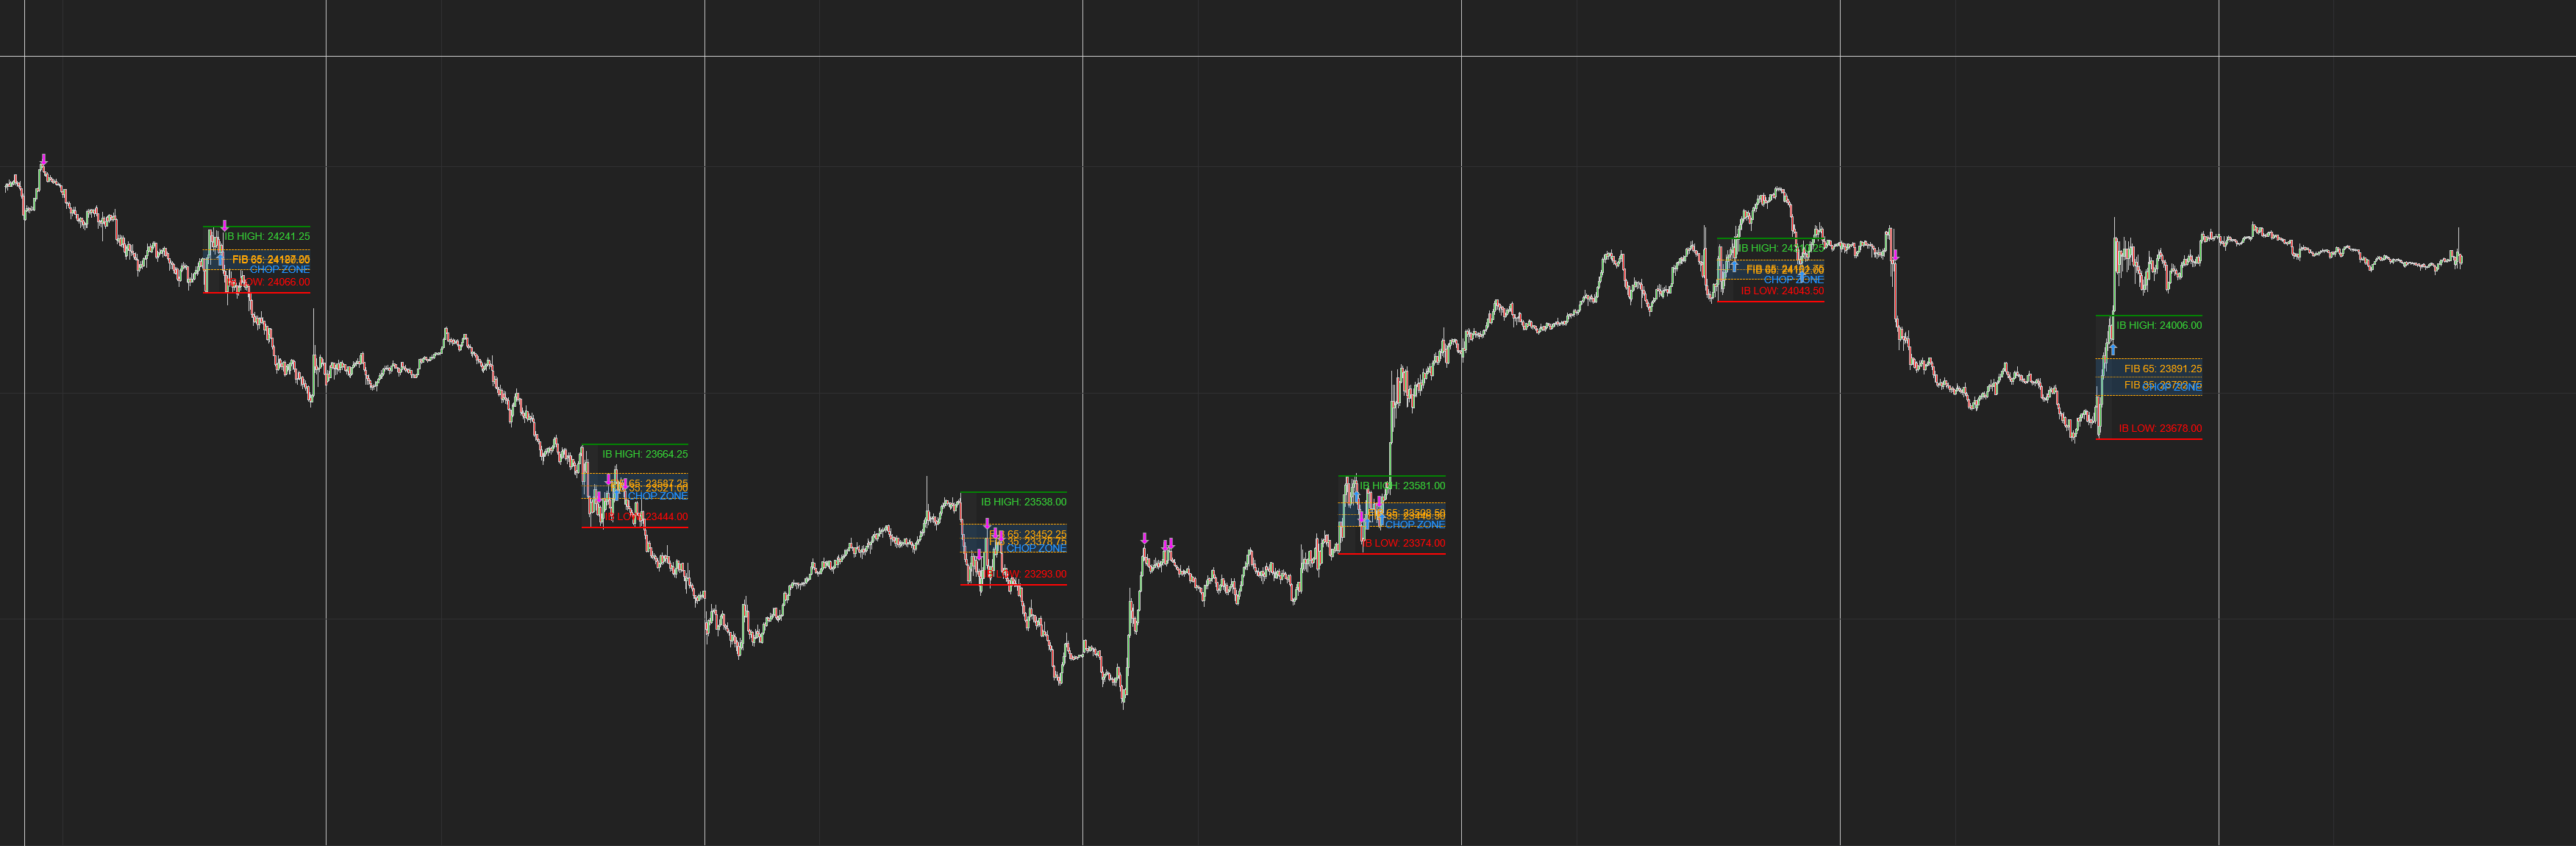
You nailed it bro.. timeless now got very less time. 🤣 Another visual representation of the same.. if price moves up put a target of green and SL just below FIB-65 if moved below then target RED with SL just above FIB-35
-
Thanks. It's initial balance + fibonacci. Longs if price closes above fib65 = 0.65 of IB range, short below fib35 = 0.35 of IB range and stops are opposite sides of those fibs so a long's SL is at fib35 - offset for example. Targets are the IB. So long target is IBhigh for example.
-
According to him... Try it for...6 years first then come back and let us know how it does.😛
-
First, thank you much @Minigems for all of your dedicated contributions and hard work. Much appreciated! Second, by chance, did you happen to glance at the coding and see what this bot is based on? Another MA cross? VWap?
-

TDU footprint v.2.0.14 zip + Big trades v1.0.0.9 - new features
TRADER replied to sarutobi's topic in Ninja Trader 8
@Minigems can u educate this indi please -
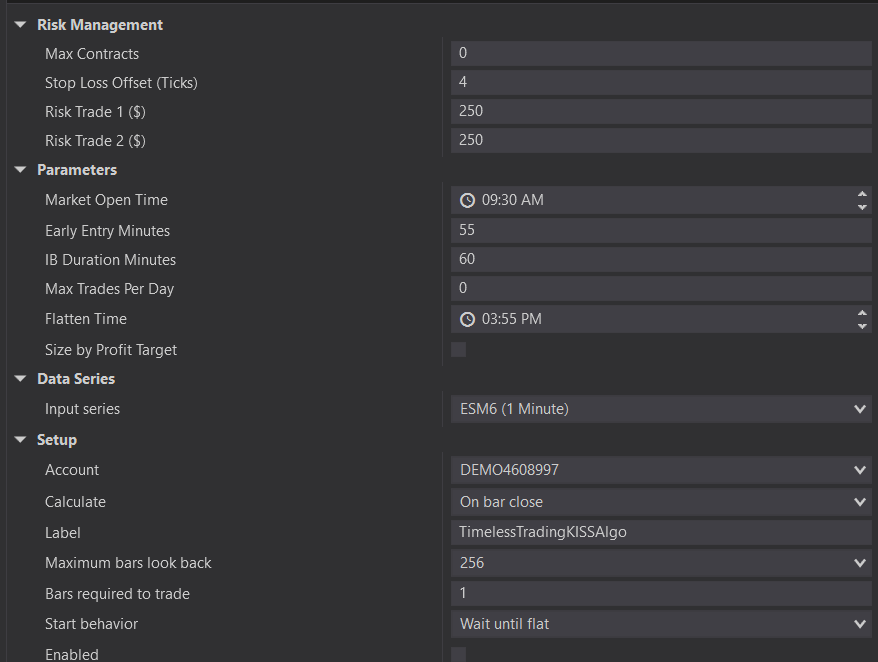
Are there any recommended bar type / timeframe settings required for this ALGO. I tried with 1 and 5 min chart and results are really bad. Also nothing from strategy is clear on target finding and TP/SL placement
-
Forex is not easy, so please be careful. Most beginners lose their money in the first three months. You should start with a "demo account" to practice without using real cash. Learning how to read charts is the first step you need to take.
-

Is this the best time to get into cryptocurrency?
hhduy replied to sakura's topic in General Forex Discussions
Actually, no one can be sure about the best time. You should start with a small amount of money first. If the price goes down, you won't lose too much. It is better to learn how the market works before putting in a lot of cash. -
Thanks for sharing: https://workupload.com/file/K2RTGDssXhK
-
Hi @kimsam @apmoo @N9TTDUAutoStrategyBuilderv1262.zipTDUVIDYa.zip Can you please help with these indi edu
-
- 1
-
-
Are there any updates? My one still not working.
-
virus alert windows 11
-
yes i got it from duckduck search thanks @Atomo12345 i have account there but it's refused to let me login , i think they deleted my account there 😞 and the new registration closed now