⤴️-Paid Ad- Check advertising disclaimer here. Add your banner here.🔥
All Activity
- Past hour
-
 Kermit 1981 reacted to a post in a topic:
Eds Retrace Plan
Kermit 1981 reacted to a post in a topic:
Eds Retrace Plan
-
Kermit 1981 reacted to a post in a topic:
A new diamond in the rough- a very good educator
- Today
-
thanks fxzero anyone re up SBS auto trader
-

HFMarkets (hfm.com): Market analysis services.
AllForexnews replied to AllForexnews's topic in Fundamental Analysis
Date: November 13, 2025. US Shutdown Ends, Fed Split on Rate Cuts, and UK Data Weighs on the Pound The longest government shutdown in the history of the US has officially come to an end. However, even with the shutdown over, today's inflation report may still be postponed. According to Goldman Sachs, the Bureau of Labor statistics will likely schedule the NFP Employment Change for early next week. Economists and analysts continue to expect the inflation rate to remain at 3%, with employment continuing to weaken. As a result, the stock market continues to rise, while the US Dollar remains unchanged. The price movement is largely due to its impact on interest rates. However, two members of the Federal Reserve officially came out opposing a rate cut in December. As a result, the possibilities of a rate cut fell from 66% to 52% according to the Chicago Exchange. Although many economists continue to advise that the Federal Reserve is still likely to cut rates in December. GBPUSD - Poor Economic Data Continues For the UK The British Pound continues to decline for a third consecutive day, with downward momentum gaining due to further poor data. The UK's employment data was originally triggering the downward price movement of the week. This includes the UK's Unemployment Rate rising to 5% and salary earnings falling 0.2% below expectations. However, today's UK Gross Domestic Product further increases the downward momentum. The UK's Gross Domestic Product fell from 0.0% to -0.1% and below previous expectations. The GDP expectations, which are also made public by the Office For National Statistics, also fell from 0.3% to 0.1%. Since the announcement at 07:00 (GMT), the price of the Pound fell 0.17%, but has since seen up-and-down volatility. A positive factor for the Pound is Health Minister Wes Streeting de-escalating the latest political tensions. Sources within the Labor Party also reported a possible leadership change, with Health Minister Wes Streeting emerging as a potential candidate. However, Mr Streeting has since advised he has no desire to oust the current UK Prime Minister. The British Pound is the worst performing currency of the week along with the Japanese Yen. The best performing currency remains the Swiss Franc and Australian Dollar. NASDAQ - Cisco Beat Earnings Expectations, But Fed Members Oppose a December Cut The NASDAQ and S&P 500 saw a day marked by contrasting performances between the first and second halves of the day. The NASDAQ rose in value during the Asian and US Sessions but fell during the US session. The decline was largely due to the comments made by two members of the Federal Reserve. Two Federal Reserve officials voiced opposition to another interest rate cut at the December meeting, adding uncertainty to the Fed's policy outlook. Previously, members had taken a neutral stance or advised that a cut was not certain. However, in recent weeks this is the first time members have outright opposed a rate cut. Comments from Susan Collins, President of the Boston Fed, and Raphael Bostic, President of the Atlanta Fed, indicate the rate-setting committee may be shifting away from what was previously expected to be a third consecutive rate reduction next month. If the Federal Reserve does not cut in December, the NASDAQ could decline between 4-7% according to JP Morgan's Strategists. NASDAQ (USA100) 30-Minute Chart A positive factor for the NASDAQ is the end of the US shutdown officially coming to an end as well as the latest positive earnings reports. Last night, Cisco Systems made public their earnings for the 3rd quarter. The company's revenue beat expectations by $11 million and earnings beat expectations by $0.02. In addition to this, an important factor for shareholders is the company's forward-guidance figures were significantly higher than previous data. Cisco stocks rose 3.14% on Wednesday and a further 7% after the announcement of the company's earnings. On Wednesday, 58% of the most influential stocks (weight above 0.50%) rose in value with AMD stocks witnessing the strongest gains (+9.00%). NASDAQ Component Performance - 12th Nov NASDAQ - Technical Analysis Even with the decline during yesterday's Asian session the price of the NASDAQ remains above most Moving Averages. The price is also trading slightly above the RSI's neutral level on the 30-minute timeframe. The NASDAQ continues to form higher highs and lows, but has not broken above the resistance level at $25,793.00. The price is almost forming a 'head and shoulders' price pattern, which would indicate a downward trend. This is something investors will continue to monitor, and if the price falls below $25,570.00, the 'head and shoulders' pattern will become more visible. However, if the price rises above $25,662.20, the pattern and bearish signal will fade, and buy signals will strengthen. Key Takeaway Points : US government shutdown ends, but key economic reports such as inflation and employment data may still face delays. Rate-cut expectations fell from 66% to 52% after two Fed officials publicly opposed a December reduction. Economists and analysts continue to expect the inflation rate to remain at 3%, with employment continuing to weaken. UK economic data disappoints, with GDP contracting by 0.1% and unemployment rising, pressuring the British Pound further. Cisco released its Q3 earnings, beating revenue estimates by $11 million and EPS by $0.02, with stronger forward guidance. Cisco's stocks rose 7.00%. Always trade with strict risk management. Your capital is the single most important aspect of your trading business. Please note that times displayed based on local time zone and are from time of writing this report. Click HERE to access the full HFM Economic calendar. Want to learn to trade and analyze the markets? Join our webinars and get analysis and trading ideas combined with better understanding of how markets work. Click HERE to register for FREE! Click HERE to READ more Market news. Michalis Efthymiou HFMarkets Disclaimer: This material is provided as a general marketing communication for information purposes only and does not constitute an independent investment research. Nothing in this communication contains, or should be considered as containing, an investment advice or an investment recommendation or a solicitation for the purpose of buying or selling of any financial instrument. All information provided is gathered from reputable sources and any information containing an indication of past performance is not a guarantee or reliable indicator of future performance. Users acknowledge that any investment in Leveraged Products is characterized by a certain degree of uncertainty and that any investment of this nature involves a high level of risk for which the users are solely responsible and liable. We assume no liability for any loss arising from any investment made based on the information provided in this communication. This communication must not be reproduced or further distributed without our prior written permission. -
⭐ Azazel reacted to a post in a topic:
Bitcoin Jackpot Bounty and Affiliate Program!
-
⭐ RichardGere reacted to a post in a topic:
@@RenkoKings ImTREX
-

Bitcoin Jackpot Bounty and Affiliate Program!
CryptoFluxor replied to JohnDyson's topic in Cryptocurrencies
Bitcoin Jackpot’s bounty and affiliate program aim to reward users for promoting the platform, but investors should exercise caution. Such schemes often lack transparency and carry potential risks. Always research thoroughly, verify legitimacy, and avoid committing funds without clear information on payout structures, regulatory compliance, and project credibility.- 1 reply
-
- 1
-
-
Litecoin Cash: A Faster way Of Transaction
CryptoFluxor replied to Marty Landry's topic in Cryptocurrencies
Litecoin Cash claims to offer faster transactions, but it lacks significant adoption and developer support compared to major cryptocurrencies. Its network activity remains low, and trading volumes are limited. Without strong community backing or real-world use cases, Litecoin Cash struggles to prove its long-term value or reliability in the market. -
Ethereum (ETH) regained momentum, recovering losses as strong support formed near $2,500. Buyers are showing renewed interest, keeping the trend positive. If ETH sustains above this level, it may target $2,650 next. Meanwhile, LMGX also shows steady growth, attracting attention amid improving market sentiment.
-
 svew joined the community
 -
Hi, do you perhaps have V2? Still looking. Would really appreciate it!
-
MaxNguni reacted to a post in a topic:
LegendaryTrader Indicator - Newest Versions
-
Hello all, wondering if there is a manual or video on how to use this properly. Thanks
-
 Starlet8223 reacted to a post in a topic:
SBS Autotrader latest Version
Starlet8223 reacted to a post in a topic:
SBS Autotrader latest Version
-
techfo reacted to a post in a topic:
Eds Retrace Plan
-
techfo reacted to a post in a topic:
LegendaryTrader Indicator - Newest Versions
-
GWP reacted to a post in a topic:
LegendaryTrader Indicator - Newest Versions
-
adonis reacted to a post in a topic:
@@RenkoKings ImTREX
-
https://limewire.com/d/NRlcr#xmhaDqd4ux
-
AlphOmega Elliott Wave for Metastock 18. https://www.metastock.com/customer/support/download/updatesandpatches
- Yesterday
-
I reviewed the code, now its going well so far in backtesting. needed some refinement.

-
enjoy .. https://workupload.com/file/dPqEPeEb8g5 indo-investasi.com please confirm if ok..
-
- 8
-
-
change to xml place in nt-templates- strategy predator order entry folder A42Signal.txt
-
HFMarkets (hfm.com): Market analysis services.
AllForexnews replied to AllForexnews's topic in Fundamental Analysis
Date: November 12, 2025. Bitcoin Holds the Line at $100,000: Support or Stall? After several weeks under selling pressure, Bitcoin seems to be finding its footing. The world’s largest cryptocurrency has paused its decline around the $100,000 level, an area reinforced by the 50-week simple moving average (SMA) and the lower Bollinger Band, two key indicators that often act as major long-term supports. This confluence suggests that BTC’s current range may represent a short-term floor, though momentum remains fragile. On the weekly chart, the Relative Strength Index (RSI) and Stochastic oscillator continue to trend lower, with the latter nearing oversold territory. The MACD also remains deep in negative territory, underlining persistent bearish sentiment. Yet, the daily chart shows tentative improvement. The Stochastic has begun recovering from oversold levels, while the RSI edges towards neutral ground. Meanwhile, the MACD lines are nearing a potential bullish crossover, a setup that, if confirmed, could open the door for renewed upside momentum. Key levels to watch: Support: $104,000 and $100,000 (50-week SMA and lower Bollinger Band) Resistance: $106,500 and $109,000 Bitcoin appears to be stabilising, but a convincing recovery will require sustained strength above the $109,000-$112,000 area. The Bigger Picture: Can the Bulls Reclaim Control? Bitcoin’s recent pause coincides with a modest recovery in risk appetite, a mix of technical consolidation and cautious macro optimism. Renewed hopes for a US government shutdown lifted crypto alongside equities. Still, this isn’t a story of quick rebounds, it’s about whether the right combination of technical signals, liquidity, and investor sentiment can realign to invite bulls back before year-end. Fundamentals: A Market Catching Its Breath Hovering around the $100,000 psychological level, Bitcoin sits at a crucial point between consolidation and recovery. The short-term holder cost basis near $112,500 marks a key boundary, breaking above it could confirm renewed accumulation. Roughly 71% of BTC supply remains in profit, which historically signals a mid-cycle cooldown rather than a full bear market. Yet momentum has cooled: long-term holders have offloaded more than 300,000 BTC since July, a rare occurrence hinting at fatigue rather than panic. Despite the slowdown, the broader picture remains stable. The Relative Unrealised Loss ratio sits near 3%, suggesting traders remain defensive but not distressed. In essence, traders seem to be hedging exposure rather than exiting positions, a sign of consolidation, not collapse. BTC Market Structure: The Hidden Drivers of Volatility Beyond headlines and price swings, deeper market mechanics are shaping Bitcoin’s recent behaviour. Shifts in funding rates, collateral settings, and ETF hedging activity have become key drivers of short-term volatility. October’s shakeout, which wiped out nearly $19 billion in leveraged positions, underscored how changes in derivatives spreads can move Bitcoin as sharply as any macro event. When basis spreads widen, arbitrage traders tend to buy spot and short futures, reducing exchange supply and lifting prices. When those spreads compress, the unwind has the opposite effect, adding supply and pressure. ETF Flows: Demand Slowly Returns After six consecutive sessions of outflows totalling $660 million, US-listed Bitcoin ETFs have finally flipped back to net inflows, with around $240 million entering the market. While one day of green doesn’t erase a week of red, it signals a possible turning point, the largest institutional buyers may be shifting back to accumulation. ETF flows are now one of the clearest barometers of real demand. A sustained streak of five to ten days of inflows could ease mechanical sell pressure and re-establish a structural bid capable of pushing BTC back above key resistance levels around $112,000-$113,000. Until then, investors remain cautiously optimistic. Liquidity: The Hidden Bullish Catalyst The global liquidity backdrop is quietly becoming more supportive. The world’s broad money supply has climbed to a record $142 trillion, up nearly 7% year-on-year, while signals from the New York Fed suggest that quantitative tightening may soon pause, or even reverse. If central banks maintain looser liquidity conditions, Bitcoin could again act as a magnet for both speculative and institutional capital, mirroring earlier reflation phases when ample cash searched for higher returns in crypto and equities. Holder Activity: Conviction, Not Capitulation Recent headlines about ‘OG whale dumping’ only tell part of the story. On-chain data reveals that much of this movement stems from address upgrades, custody migrations, or collateral use, not mass liquidation. Meanwhile, ETF investors have shown remarkable resilience, holding through a 20% correction without significant withdrawals. The takeaway? Conviction hasn’t disappeared, it’s simply shifting hands, from long-time holders to more structured, institutional participants. As liquidity builds and ETF demand stabilises, Bitcoin’s foundation appears solid, even if sentiment is still recovering. Bitcoin Price Forecast: What’s Next for BTC? The $100,000 level remains a pivotal line in the sand. A decisive bounce from this zone could reinforce confidence among both short-and long-term participants. A confirmed move above $112,000 could open the path toward a broader recovery, possibly testing $120,000–$125,000 by year-end if ETF inflows persist and liquidity expands globally. Conversely, failure to defend the $100,000 level could trigger another retest toward $95,000, where strong historical support lies. For now, Bitcoin’s outlook remains cautiously bullish, supported by solid structural underpinnings but constrained by weak momentum. Traders and investors should continue to watch ETF flows, liquidity indicators, and key resistance levels to gauge whether this is simply a mid-cycle pause or the start of the next Bitcoin uptrend. For now, Bitcoin's outlook remains cautiously bullish , supported by solid structural underpinnings but constrained by weak momentum. Traders and investors should continue to watch ETF flows, liquidity indicators, and key resistance levels to gauge whether this is simply a mid-cycle pause or the start of the next Bitcoin uptrend . Always trade with strict risk management. Your capital is the single most important aspect of your trading business. Please note that times displayed based on local time zone and are from time of writing this report. Click HERE to access the full HFM Economic calendar. Want to learn to trade and analyze the markets? Join our webinars and get analysis and trading ideas combined with better understanding of how markets work. Click HERE to register for FREE! Click HERE to READ more Market news. Andria Pichidi HFMarkets Disclaimer: This material is provided as a general marketing communication for information purposes only and does not constitute an independent investment research. Nothing in this communication contains, or should be considered as containing, an investment advice or an investment recommendation or a solicitation for the purpose of buying or selling of any financial instrument. All information provided is gathered from reputable sources and any information containing an indication of past performance is not a guarantee or reliable indicator of future performance. Users acknowledge that any investment in Leveraged Products is characterized by a certain degree of uncertainty and that any investment of this nature involves a high level of risk for which the users are solely responsible and liable. We assume no liability for any loss arising from any investment made based on the information provided in this communication. This communication must not be reproduced or further distributed without our prior written permission. -
@apmoo @kimsam
-
Hey Kimsam, Would you mind sharing that updated version please? Thanks
-
does anyone have the breakout bot they offer or any others? thank you for any help
-
Can your share your predator template
-
That’s looks amazing
-
Overview (3).doc
-
EdsRetracePlan2025 (2).zipthere is no manual for it, but here is his newest version
-
Can one of our educators please check?
-
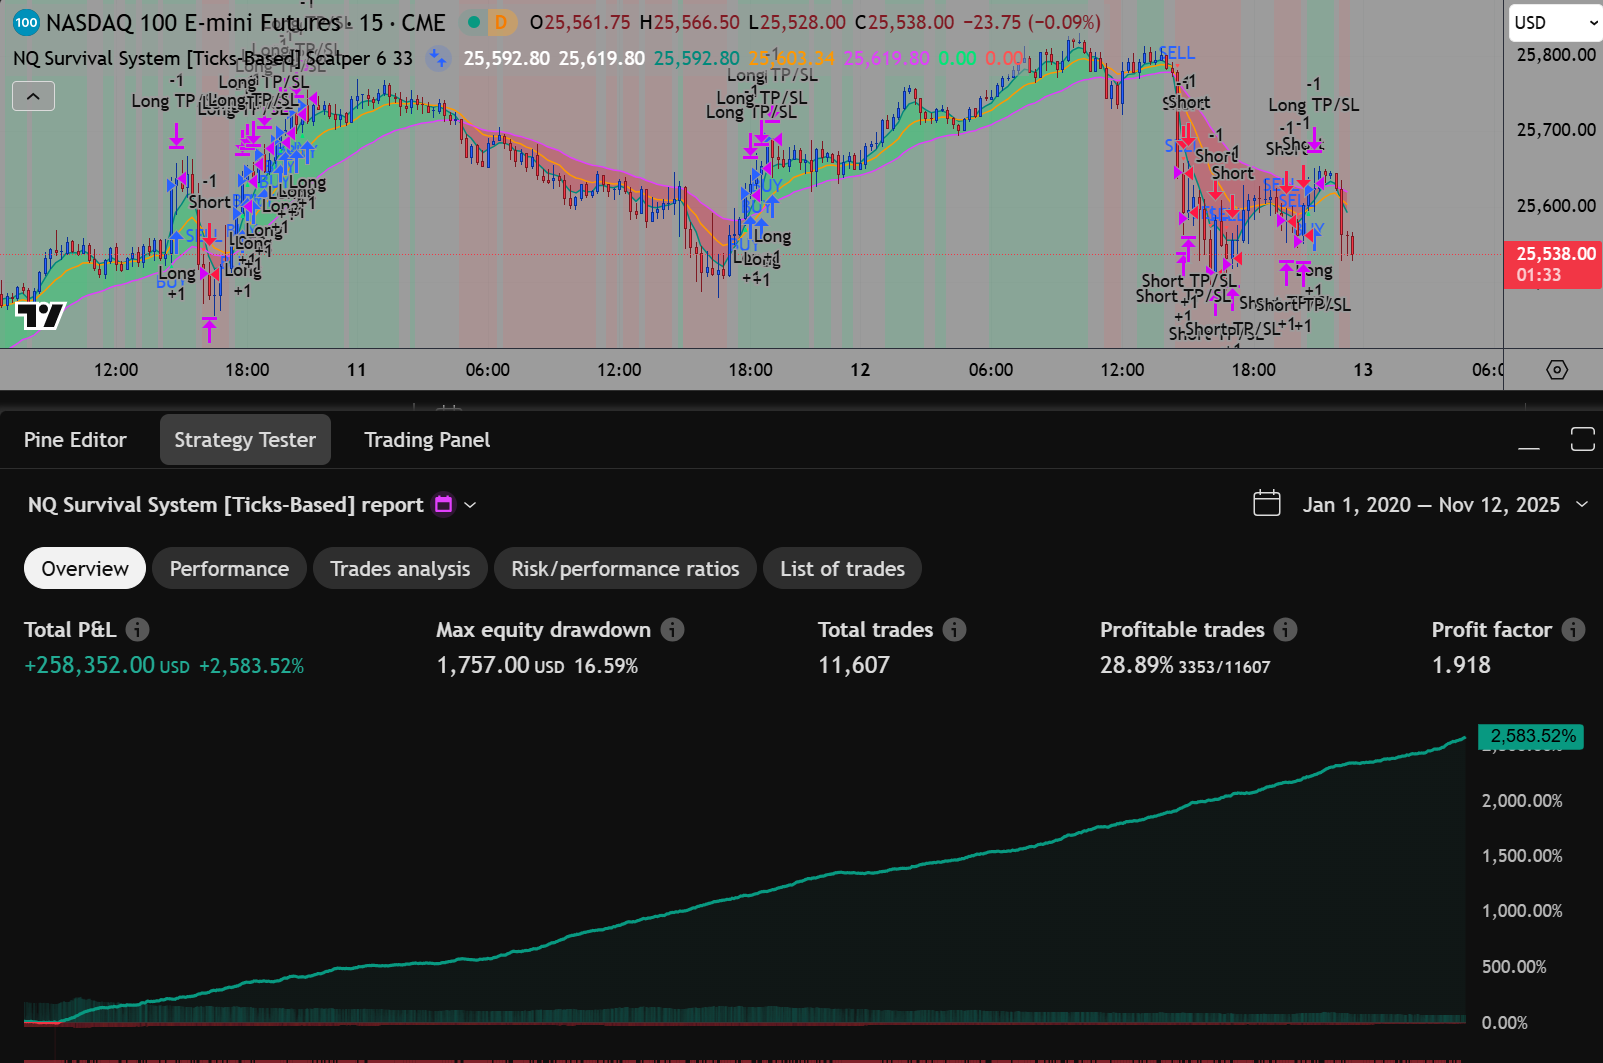
as the autoentry is a ATM type strategy you would only be able to do market replay to test, but the indicator has the FourTwoSignal exposed so I use Predator order entry strategy and use custom signal and can backtest any time period on a chart. so here is the last 20 days with 100 stop, 45 tgt 1 NQ in 1 min chart
-
 Hi everyone, I’m looking for the Virtual Intensive Trader Training course from F.u.t.e.x . If anyone has it, I’d really appreciate it if you could share it. Thanks a lot!
-
- 1
-
-
are these educated?