⤴️-Paid Ad- Check advertising disclaimer here. Add your banner here.🔥

loki0007
Members-
Posts
12 -
Joined
-
Last visited
Content Type
Profiles
Forums
Articles
Everything posted by loki0007
-
can you post it here
-
-
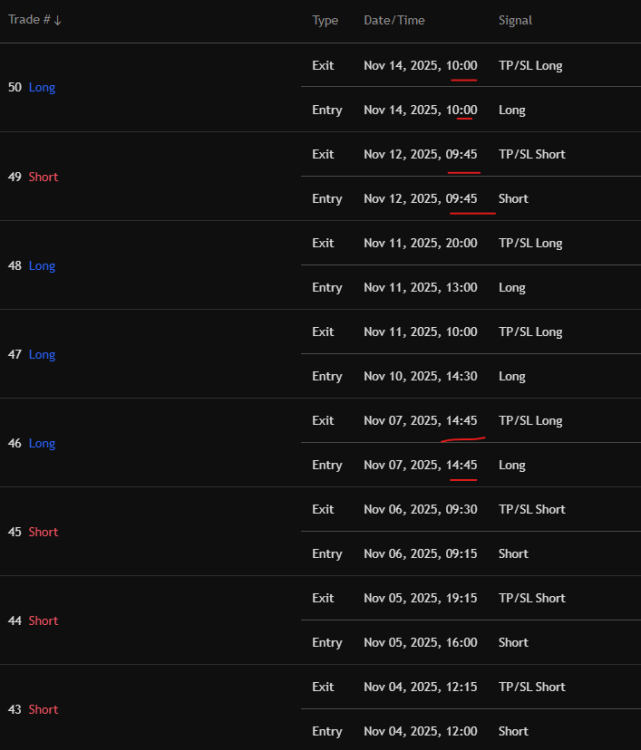
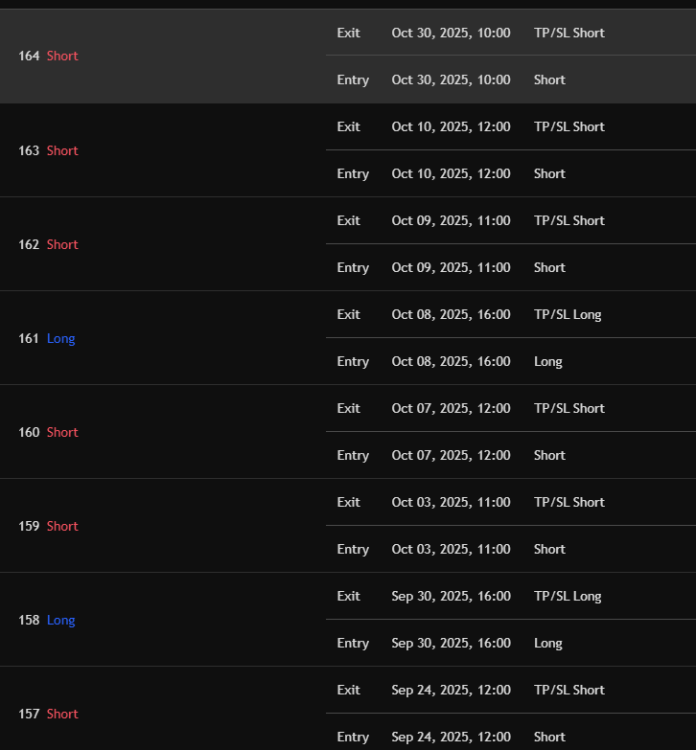
My guy check the trades Some trades duration is 0 seconds The absolute minimum trade duration is 1 bar (3 minutes), and in some cases effectively 0 minutes (entry and exit on the exact same 3-minute Heikin-Ashi bar) when the market gaps or sprints straight to the fixed 800-tick profit target or 500-tick stop-loss. With 800 ticks tp and 500 ticks sl still this mf has 0 min trade duration . I suggest this to test on Ninjatrader and please don't trust tradingview results Tradingview is absolute s*** when it comes to backtesting.
-
Normal Candle Fix.txt
-
-
check this code use this on normal candlestick if used on heikenishi candlestick you get fake results
-
//@version=5 strategy("Simple Market Metrics Trading Rules [Normal Candles Fixed]", overlay=true, initial_capital=1000, default_qty_type=strategy.percent_of_equity, default_qty_value=100) // === REMOVE HEIKIN ASHI WARNING & DEPENDENCY === var bool d7c = true // Disable Heikin Ashi warning var const string x1z = "***** Simple Market Metrics Trading Rules *****" var const string p2k = "\n\n1. How to enter a trade:\n• Wait for a Buy or Sell signal to appear" var const string l4m = "\n• If the signal remains when the candle closes, enter the trade with a market or limit order" var const string b9n = "\n\n2. How to exit a trade:\n• Take profit when the price reaches the profit target line" var const string t8j = "\n• Stop out of the trade if the white dot remains on the opposite side of the profit wave only when the candle has closed." var const string q0z = x1z + p2k + l4m + b9n + t8j var const string e5v = "--------| Frequently Asked Questions |--------" var const string u3b = "\n\n1. What markets can this be traded with?\n• Simple Market Metrics works with any market, but the ES & NQ Futures are the preferred markets to trade this system with." var const string w6t = "\n\n2. What candle type should be used?\n• Simple Market Metrics was designed to be used on Heikin Ashi candles." var const string r1y = "\n\n3. What are the preferred trading hours?\n• The preferred hours to trade are during the New York session between 10:00am EST and 3:00pm EST." var const string z7m = "\n\n4. What timeframe should I trade?\n• The 1 and 2 minute timeframes are preferred with ES & NQ Futures" var const string j9p = "\n\n5. What should I set the profit targets to?\n• ES - 1 min: 4\n• ES - 2 min: 8\n• NQ - 1 min: 20\n• NQ - 2 min: 40" var const string k9z = "\n\n6. How many contracts should I start trading with prop firm accounts?\n• 50k - 5 micros on MES or MNQ \n• 150k - 2 minis on ES or NQ" var const string k3l = e5v + u3b + w6t + r1y + z7m + j9p + k9z var const string d5q = "Some final notes:\n\nThe Simple Market Metrics trading system has been built specifically for trading the ES & NQ Futures markets, with the goal of small but consistent daily profits." var const string c2a = "\n\nAlthough you may trade any market and timeframe you wish, it is up to you to determine the best settings for other markets and timeframes." var const string n4g = "\n\nTrading is risky, do not trade with money you are not comfortable losing.\nControl your risk by managing your position size accordingly, and please practice on a sim account before using real money." var const string f6b = "\n\nIf you need further assistance, contact us at [email protected]" var const string y8s = d5q + c2a + n4g + f6b var const string r0p = "------------------> START HERE <------------------" g1r = input.bool(false, title="Please Read The Trading Rules ----->", group=r0p, tooltip=q0z) h1f = input.bool(false, title="Frequently Asked Questions ------->", group=r0p, tooltip=k3l) b2l = input.bool(false, title="Final Notes & Contact Info --------->", group=r0p, tooltip=y8s) var b8v = '----- Signal Settings -----' n7s = input.bool(true, title='Enable Buy & Sell Signals', group=b8v) c6j = input.color(color.new(#4caf50, 0), 'Buy Signal Color', group=b8v) q8o = input.color(color.new(#b22833, 0), 'Sell Signal Color', group=b8v) m6r = input.bool(true, title='Enable Buy & Sell Price', group=b8v) t7z = input.bool(true, title='Enable Chop Filter', group=b8v, tooltip='This helps to reduce signals during choppy markets, and will produce less signals overall when enabled.') var r7p = '----- Strategy Settings -----' // New user inputs for Take Profit and Stop Loss w3f = input.int(50, title='Take Profit (Ticks/Pips)', group=r7p) s6p = input.int(45, title='Stop Loss (Ticks/Pips)', group=r7p) j4c = input.bool(true, title='Enable Profit Target Lines', group=r7p) v1n = input.int(10, title='Max Profit Target Lines', group=r7p, tooltip='Maximum amount of profit target lines to display on your chart.') y9q = input.color(color.new(color.yellow, 0), 'Profit Target Lines Color', group=r7p) s5d = input.bool(true, "Enable Profit Wave", group=r7p) x3m = input.color(color.new(#00ff8480, 50), 'Profit Wave Bullish Top Color', group=r7p) e4a = input.color(color.new(color.green, 50), 'Profit Wave Bullish Bottom Color', group=r7p) g9j = input.color(color.new(#8c0000, 50), 'Profit Wave Bearish Top Color', group=r7p) u5r = input.color(color.new(#ff0000, 50), 'Profit Wave Bearish Bottom Color', group=r7p) var t6v = '----- Background trendSwitch Settings -----' f3n = input.bool(true, "Enable Background trendSwitch Color", group=t6v) r3k = input.color(color.new(#66ff00, 70), 'Bullish Background Color', group=t6v) y2w = input.color(color.new(#ff0000, 70), 'Bearish Background Color', group=t6v) var p9t = "----- Candle Settings -----" n3b = input.color(color.new(#089981, 0), 'Bullish Candle Color', group=p9t) d9k = input.color(color.new(#f23645, 0), 'Bearish Candle Color', group=p9t) o1m = input.bool(true, title='Enable Candle Color Matching', group=p9t) f2s = input.string("Profit Wave", title='Match Candle Colors To', options=["Profit Wave", "Trend"], group=p9t) var j6z = '----- Support & Resistance Settings -----' m7h = input.bool(true, title='Enable Support & Resistance Lines', group=j6z) z4n = input.color(#ff0000, 'Resistance Lines Color', group=j6z) h4g = input.color(#66ff00, 'Support Lines Color', group=j6z) c5k = input.string("Dotted", options=["Dashed", "Dotted", "Solid"], title="Support & Resistance Lines Style", group=j6z) p8r = input.int(2, "Support & Resistance Lines Width", minval=1, maxval=5, step=1, group=j6z) r9l = input.string('Close', title='Extend Lines Until', options=['Touch', 'Close'], group=j6z, tooltip='Extend the lines until price touches them or a candle closes beyond them.') e6b = 20 g0s = 50 var q5d = '----- Real Price Settings -----' t4n = input(false, title="Enable Real Price Line", group=q5d) l1w = input(false, title="Extend Real Price Line", group=q5d) y0v = input(color.new(color.white, 0), title="Real Price Line Color", group=q5d) s2m = input.string("Thin", options=["Thin", "Thick"], title="Real Price Line Width", group=q5d) n9a = input.string("Dotted", options=["Dotted", "Solid", "Dashed"], title="Real Price Line Style", group=q5d) x8o = input.bool(true, title="Enable Real Close Price Dots", group=q5d) j2l = input(color.new(color.white, 0), title="Real Close Price Dot Color", group=q5d) k9g = input.string("Small", options=["Auto", "Small", "Large"], title="Real Close Price Dot Size", group=q5d) var d3h = '----- Price Channel Settings -----' l7x = input.bool(false, "Enable Price Channel", group=d3h) q6v = input.color(color.green, 'Bottom Price Channel Color', group=d3h) n6b = input.color(#ff0000, 'Top Price Channel Color', group=d3h) g4p = input.bool(false, "Extend Lines Left", group=d3h) b3k = input.bool(false, "Extend Lines Right", group=d3h) var x4a = "----- Dashboard Settings -----" c8y = input.bool(true, title='Enable Buy & Sell Signals on Dashboard', group=x4a) d8w = input.bool(false, "Enable Level Lines", group=x4a) j5r = input.string("Solid", options=["Solid", "Dotted", "Dashed"], title="Level Lines Style", group=x4a) p6t = input.int(1, "trendSwitch Dots Size", minval=1, maxval=10, step=1, group=x4a) q1r = input.int(3, "Signal Dots Size", minval=3, maxval=10, step=1, group=x4a) u7m = input.color(color.lime, 'Money Flow Bullish Color', group=x4a) r0n = input.color(color.red, 'Money Flow Bearish Color', group=x4a) // --- New Time Filter Section --- var z1t = '----- Time Filter -----' c0s = input.bool(true, "Enable Time Filter", group=z1t) z2j = time(timeframe.period, "1600-0859", "America/New_York") w1p = time(timeframe.period, "1200-1229", "America/New_York") isForbiddenTime = c0s and (z2j or w1p) // --- End New Time Filter Section --- z9f = chart.is_heikinashi if not z9f and not d7c f3n := false n7s := false j4c := false o1m := false s5d := false m7h := false middle_price = (high + low) / 2 visible_bar_count = bar_index - ta.valuewhen(time == chart.left_visible_bar_time, bar_index, 0) middle_bar_index = bar_index[visible_bar_count / 2] var label j1l = na if (bar_index > 0) label.delete(j1l) warningText = "\n⚠️ WARNING!!! ⚠️\n\nYou MUST set the chart candle type\nto Heikin Ashi for the signals to display correctly.\n\nThis message will disappear when you've done so.\n" j1l := label.new(x=middle_bar_index, y=middle_price, text=warningText, xloc=xloc.bar_index, yloc=yloc.price, style=label.style_label_center, color=color.red, textcolor=color.white, size=size.huge, textalign=text.align_center, force_overlay=true) srcHlc3 = hlc3 srcOpen = open srcHigh = high srcLow = low srcClose = close real_price = ticker.new(prefix=syminfo.prefix, ticker=syminfo.ticker) real_close = request.security(symbol=real_price, timeframe='', expression=close, gaps=barmerge.gaps_off, lookahead=barmerge.lookahead_off) profitWaveEmaFast = ta.ema(srcClose, 😎 profitWaveEmaMedium = ta.ema(srcClose, 13) profitWaveEmaSlow = ta.ema(srcClose, 21) u8t = 1 r7c = math.max(math.max(high - low, math.abs(high - nz(close[1]))), math.abs(low - nz(close[1]))) p5y = high - nz(high[1]) > nz(low[1]) - low ? math.max(high - nz(high[1]), 0) : 0 d4h = nz(low[1]) - low > high - nz(high[1]) ? math.max(nz(low[1]) - low, 0) : 0 v5g = 0.0 v5g := nz(v5g[1]) - (nz(v5g[1]) / u8t) + r7c p1b = 0.0 p1b := nz(p1b[1]) - (nz(p1b[1]) / u8t) + p5y b6t = 0.0 b6t := nz(b6t[1]) - (nz(b6t[1]) / u8t) + d4h x9n = p1b / v5g * 100 d1v = b6t / v5g * 100 t5c = (srcHigh + srcLow) / 2 - (1.3 * ta.atr(8)) j6r = (srcHigh + srcLow) / 2 + (1.3 * ta.atr(8)) float r8d = na float t9f = na x2m = 0 r8d := srcClose[1] > r8d[1] ? math.max(t5c, r8d[1]) : t5c t9f := srcClose[1] < t9f[1] ? math.min(j6r, t9f[1]) : j6r x2m := srcClose > t9f[1] ? 1 : srcClose < r8d[1] ? -1 : nz(x2m[1], 1) u9z = x2m == 1 ? r8d : t9f y2g = u9z == r8d w1r = u9z == t9f b7f = color.gray b7f := if (srcClose > srcOpen) n3b else if (srcClose < srcOpen) d9k else b7f[1] if (o1m and f2s == "Trend") b7f := if (y2g) n3b else if (w1r) d9k else b7f[1] else if (o1m and f2s == "Profit Wave") b7f := if (srcClose > profitWaveEmaSlow) n3b else if (srcClose < profitWaveEmaSlow) d9k else b7f[1] plotcandle(srcOpen, srcHigh, srcLow, srcClose, "SMM Candles", color=b7f, wickcolor=b7f, bordercolor=b7f, force_overlay=true) x5y = color.white if (y2g) x5y := r3k else if (w1r) x5y := y2w else x5y := x5y[1] bgcolor(f3n ? x5y : na, force_overlay=true) var bool o1z = false var bool k8s = false o1z := u9z == r8d k8s := u9z == t9f mfl = ta.mfi(srcHlc3, 10) enum w0y buy = "Buy Mode" sell = "Sell Mode" none = "none" var w0y y7c = w0y.none if (x5y != x5y[1]) y7c := w0y.none a4h = srcClose > srcOpen and srcOpen == srcLow and real_close > profitWaveEmaFast and real_close > profitWaveEmaSlow p4r = srcClose < srcOpen and srcOpen == srcHigh and real_close < profitWaveEmaFast and real_close < profitWaveEmaSlow v7g = m6r ? "\n$" + str.tostring(real_close, format.mintick) : "" bool e1p = true bool t2y = true if (t7z) e1p := math.floor(x9n) > math.floor(d1v) and math.floor(x9n) >= 45 t2y := math.floor(d1v) > math.floor(x9n) and math.floor(d1v) >= 45 else e1p := true t2y := true var int u0k = na w2f = t7z ? mfl > 52 : true o4k = o1z and y2g and a4h and y7c != w0y.buy and w2f and e1p if (o4k and n7s) y7c := w0y.buy label.new(bar_index, low, style=label.style_label_up, color=c6j, size=size.normal, yloc=yloc.belowbar, text="Buy" + v7g, textcolor=color.white, force_overlay=true) u0k := bar_index b7m = t7z ? mfl < 48 : true o5t = k8s and w1r and p4r and y7c != w0y.sell and b7m and t2y if (o5t and n7s) y7c := w0y.sell label.new(bar_index, high, style=label.style_label_down, color=q8o, size=size.normal, yloc=yloc.abovebar, text="Sell" + v7g, textcolor=color.white, force_overlay=true) u0k := bar_index // Strategy entry with TP and SL. Now includes time filter. if (o4k and n7s and not isForbiddenTime) strategy.entry("Long", strategy.long, when=barstate.isconfirmed) strategy.exit("TP/SL Long", from_entry="Long", profit=w3f, loss=s6p) if (o5t and n7s and not isForbiddenTime) strategy.entry("Short", strategy.short, when=barstate.isconfirmed) strategy.exit("TP/SL Short", from_entry="Short", profit=w3f, loss=s6p) // The original exit logic based on the Profit Wave has been removed, as the `strategy` functions handle // exits based on profit and loss targets. You can still manually close a trade based on that rule // when using the strategy tester and visual backtesting. var line[] n9r = array.new_line(0) var label[] r2j = array.new_label(0) var float x0l = na if ((o4k or o5t) and n7s and j4c) if array.size(n9r) >= v1n o9m = array.get(n9r, 0) k2f = array.get(r2j, 0) line.delete(o9m) label.delete(k2f) array.remove(n9r, 0) array.remove(r2j, 0) x0l := o4k ? real_close + (w3f * syminfo.mintick) : o5t ? real_close - (w3f * syminfo.mintick) : na a2d = line.new(bar_index - 7, x0l, bar_index + 5, x0l, color=y9q, width=2, force_overlay=true) array.push(n9r, a2d) q9p = label.new(bar_index - 3, x0l, text="$" + str.tostring(x0l, format.mintick), style=label.style_none, textcolor=y9q, force_overlay=true) array.push(r2j, q9p) o7g = if not na(u0k) and bar_index > u0k y7c == w0y.buy ? srcHigh >= x0l : y7c == w0y.sell ? srcLow <= x0l : na alertcondition(condition=o4k and e1p, title='Buy alert', message='Buy') alertcondition(condition=o5t and t2y, title='Sell alert', message='Sell') alertcondition(condition=n7s and j4c ? o7g : na, title="Profit Target", message="Profit Target Hit!") if o7g x0l := na u0k := na p3f = plot(s5d ? profitWaveEmaFast : na, title="Profit Wave Line 1", color=color.new(color.white, 100), linewidth=1, force_overlay=true) h3m = plot(s5d ? profitWaveEmaMedium : na, title="Profit Wave Line 2", color=color.new(color.white, 100), linewidth=1, force_overlay=true) b0y = plot(s5d ? profitWaveEmaSlow : na, title="Profit Wave Line 3", color=color.new(color.white, 100), linewidth=1, force_overlay=true) a3c = real_close > profitWaveEmaSlow ? x3m : color.new(color.lime, 100) s8k = real_close > profitWaveEmaSlow ? e4a : color.new(color.green, 100) fill(p3f, h3m, a3c) fill(h3m, b0y, s8k) q4m = real_close < profitWaveEmaSlow ? u5r : color.new(#ff0000, 100) g7n = real_close < profitWaveEmaSlow ? g9j : color.new(#8c0000, 100) fill(p3f, h3m, q4m) fill(h3m, b0y, g7n) w4z = switch c5k "Solid" => line.style_solid "Dotted" => line.style_dotted "Dashed" => line.style_dashed ph1 = ta.pivothigh(srcHigh, e6b, e6b) lp8 = ta.pivotlow(srcLow, e6b, e6b) var line[] j3r = array.new_line(0) var line[] u5x = array.new_line(0) var int[] f4z = array.new_int(0) var int[] d5m = array.new_int(0) q6x = 500 f_manage_line_limit(a5h, p2x) => if array.size(a5h) > g0s line.delete(array.shift(a5h)) array.shift(p2x) if (m7h and not na(ph1) and bar_index[e6b] >= bar_index - q6x) h9s = srcHigh[e6b] y3k = bar_index[e6b] x4m = line.new(y3k, h9s, bar_index + 1, h9s, style=w4z, width=p8r, color=z4n, extend=extend.right, force_overlay=true) array.push(j3r, x4m) array.push(f4z, na) f_manage_line_limit(j3r, f4z) if (m7h and not na(lp8) and bar_index[e6b] >= bar_index - q6x) p0k = srcLow[e6b] l9h = bar_index[e6b] g9t = line.new(l9h, p0k, bar_index + 1, p0k, style=w4z, width=p8r, color=h4g, extend=extend.right, force_overlay=true) array.push(u5x, g9t) array.push(d5m, na) f_manage_line_limit(u5x, d5m) if array.size(j3r) > 0 z8v = r9l == 'Close' ? srcClose : srcHigh for i = 0 to array.size(j3r) - 1 b2m = array.get(j3r, i) o6p = line.get_y1(b2m) q3n = array.get(f4z, i) if na(q3n) line.set_x2(b2m, bar_index) line.set_extend(b2m, extend.none) if na(q3n) and z8v >= o6p line.set_x2(b2m, bar_index) line.set_extend(b2m, extend.none) array.set(f4z, i, bar_index) if array.size(u5x) > 0 t0w = r9l == 'Close' ? srcClose : srcLow for i = 0 to array.size(u5x) - 1 a2r = array.get(u5x, i) v0g = line.get_y1(a2r) z9l = array.get(d5m, i) if na(z9l) line.set_x2(a2r, bar_index) line.set_extend(a2r, extend.none) if na(z9l) and t0w <= v0g line.set_x2(a2r, bar_index) line.set_extend(a2r, extend.none) array.set(d5m, i, bar_index) v4n = (x8o and k9g == "Auto" ? display.all : display.none) p1s = (x8o and k9g == "Small" ? display.all : display.none) m0x = (x8o and k9g == "Large" ? display.all : display.none) g9v = switch s2m "Thin" => 1 "Thick" => 2 if (t4n and (n9a == "Solid")) t2r = line.new(bar_index[1], real_close, bar_index, real_close, xloc.bar_index, (l1w ? extend.both : extend.right), y0v, line.style_solid, g9v, force_overlay=true) line.delete(t2r[1]) if (t4n and (n9a == "Dotted")) k2h = line.new(bar_index[1], real_close, bar_index, real_close, xloc.bar_index, (l1w ? extend.both : extend.right), y0v, line.style_dotted, g9v, force_overlay=true) line.delete(k2h[1]) if (t4n and (n9a == "Dashed")) n7r = line.new(bar_index[1], real_close, bar_index, real_close, xloc.bar_index, (l1w ? extend.both : extend.right), y0v, line.style_dashed, g9v, force_overlay=true) line.delete(n7r[1]) // Real Price Line + Dots logic originally created by PHVNTOM_TRADER plotchar(series=real_close, title="Real Close dots", location=location.absolute, color=j2l, editable=false, char="•", size=size.auto, display=v4n, force_overlay=true) plotchar(series=real_close, title="Real Close dots", location=location.absolute, color=j2l, editable=false, char="•", size=size.tiny, display=p1s, force_overlay=true) plotshape(series=real_close, title="Real Close dots", location=location.absolute, color=j2l, editable=false, style=shape.circle, size=size.auto, display=m0x, force_overlay=true) l5v = 9 c8k = 2.0 d3n = 100 v0x = switch g4p and b3k => extend.both g4p => extend.left b3k => extend.right => extend.none var f5k = array.new_line(0) var g5w = array.new_line(0) h7a(p1q, a3l, y4m, u9g, l0k, i8r, is1t) => line.set_xy1(p1q, a3l, y4m) line.set_xy2(p1q, u9g, l0k) line.set_color(p1q, i8r) line.set_style(p1q, is1t ? line.style_dotted : line.style_solid) if l7x if barstate.isfirst for i = 1 to l5v array.push(f5k, line.new(na, na, na, na, extend=v0x, force_overlay=true)) array.push(g5w, line.new(na, na, na, na, extend=v0x, force_overlay=true)) n1l = bar_index c5n = ta.variance(srcClose, d3n) z7r = ta.correlation(srcClose, n1l, d3n) a6v = z7r * (math.sqrt(c5n) / ta.stdev(n1l, d3n)) w5j = ta.sma(srcClose, d3n) - a6v * ta.sma(n1l, d3n) t2d = math.sqrt(c5n - c5n * math.pow(z7r, 2)) * c8k if barstate.islast v9l = a6v * (n1l - d3n + 1) + w5j - t2d k0y = a6v * n1l + w5j - t2d w8g = false for i = 0 to l5v - 2 q7p = i / (l5v - 1) g0f = q7p * t2d * 2 p9g = color.from_gradient(q7p, 0, 0.5, color.new(q6v, 00), color.new(q6v, 75)) r4n = color.from_gradient(q7p, 0.5, 1, color.new(n6b, 60), color.new(n6b, 25)) u2x = color.white if (q7p == 0.5) u2x := color.white w8g := true if q7p < 0.5 u2x := p9g if q7p > 0.5 u2x := r4n h7a(array.get(f5k, i), n1l - d3n + 1, v9l + g0f, n1l, k0y + g0f, u2x, w8g) w8g := false h7a(array.get(f5k, l5v - 1), n1l - d3n + 1, v9l + t2d * 2, n1l, k0y + t2d * 2, n6b, w8g) u4n = math.sqrt(c5n - c5n * math.pow(z7r, 2)) * 1 b3d = switch j5r "Solid" => hline.style_solid "Dotted" => hline.style_dotted "Dashed" => hline.style_dashed p0n = hline(100, color=color.new(#ff1b1b, 50), linestyle=hline.style_solid) h3r = hline(90, color=color.new(#ff2626, 50), linestyle=hline.style_solid) n9l = hline(80, color=color.new(#ff3f3f, 50), linestyle=hline.style_solid) a1t = hline(d8w ? 70 : na, color=color.new(#ff5050, 50), linestyle=b3d) d0g = hline(d8w ? 60 : na, color=color.new(#ff6464, 50), linestyle=b3d) v2c = hline(d8w ? 50 : na, color=color.new(#ff6464, 100), linestyle=b3d) l5n = hline(0, color=color.new(#047200, 50), linestyle=hline.style_solid) z1h = hline(10, color=color.new(#047e00, 50), linestyle=hline.style_solid) k6r = hline(20, color=color.new(#048900, 50), linestyle=hline.style_solid) b9t = hline(d8w ? 30 : na, color=color.new(#059f00, 50), linestyle=b3d) h4w = hline(d8w ? 40 : na, color=color.new(#06b200, 50), linestyle=b3d) y5g = hline(d8w ? 50 : na, color=color.new(#06b200, 100), linestyle=b3d) fill(p0n, h3r, color=color.new(#ff1b1b, 20), title="Overbought Extreme Background") fill(h3r, n9l, color=color.new(#ff2626, 40), title="Overbought Start Background") fill(l5n, z1h, color=color.new(#047200, 10), title="Oversold Start Background") fill(k6r, z1h, color=color.new(#047e00, 40), title="Oversold Extreme Background") t5n = y2g ? #66ff00 : #ff0000 plot(50, color=t5n, style=plot.style_circles, title="Dashboard Center Line trendSwitch Dots", linewidth=p6t) plotshape(o4k and c8y and e1p ? 10 : na, title='Dashboard Buy Signal', style=shape.labelup, location=location.absolute, text='Buy', textcolor=color.white, color=c6j) plotshape(o5t and c8y and t2y ? 90 : na, title='Dashboard Sell Signal', style=shape.labeldown, location=location.absolute, text='Sell', textcolor=color.white, color=q8o) u2t = if (mfl > 50) u7m else if (mfl < 50) r0n else color.white plot(mfl, "Dashboard Money Flow Line", color=u2t, style=plot.style_stepline) plot(o4k ? 50 : na, color=#66ff00, style=plot.style_circles, linewidth=q1r, title='Dashboard Crossover Up Dots') plot(o5t ? 50 : na, color=#ff0000, style=plot.style_circles, linewidth=q1r, title='Dashboard Crossover Down Dots')
-
It's already shared bro i didn't change anything
-
Can you send corrected code ??
-
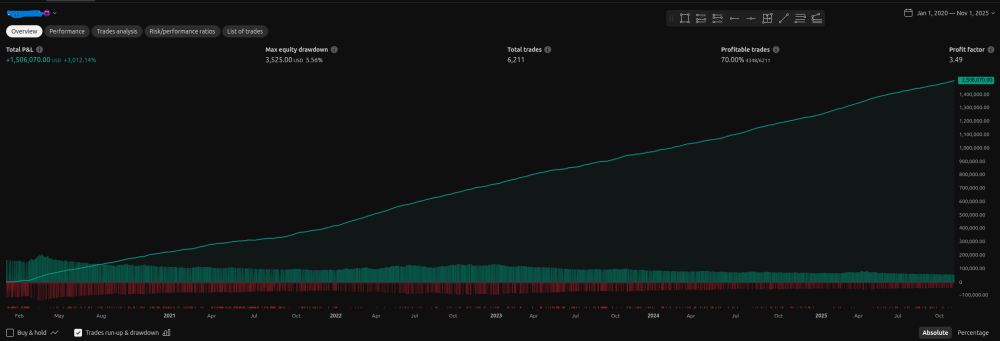
Your code has issue this backtest is too good to be true I checked it enter and exit in same min 0sec gap between entry exit
-
can u send ultimate scalper??


