⤴️-Paid Ad- Check advertising disclaimer here. Add your banner here.🔥


axsx
-
Posts
56 -
Joined
-
Last visited
Content Type
Profiles
Forums
Articles
Everything posted by axsx
-
I also find Qmomentum the only indicator that is making sense. How do you use it ? want to understand how you use it
-
is it not demoRithmic datafeed is only free for 14 days ? how can you use the demoRithmic for such a long time ?
-
What is the best and cheapest option for getting L2 data for NT 8 in USA ?
-
do you want to post your changes here that work with IB gateway, we can see if that can be improved ?
-
is the above educated ?
-
@kimsam Any chance of prelook or beta release to test the AI system you are coding ? I am happy to test it on NQ.
-
can you explain significance of major positive by volume and major negative by volume ? What do they represent ?
-
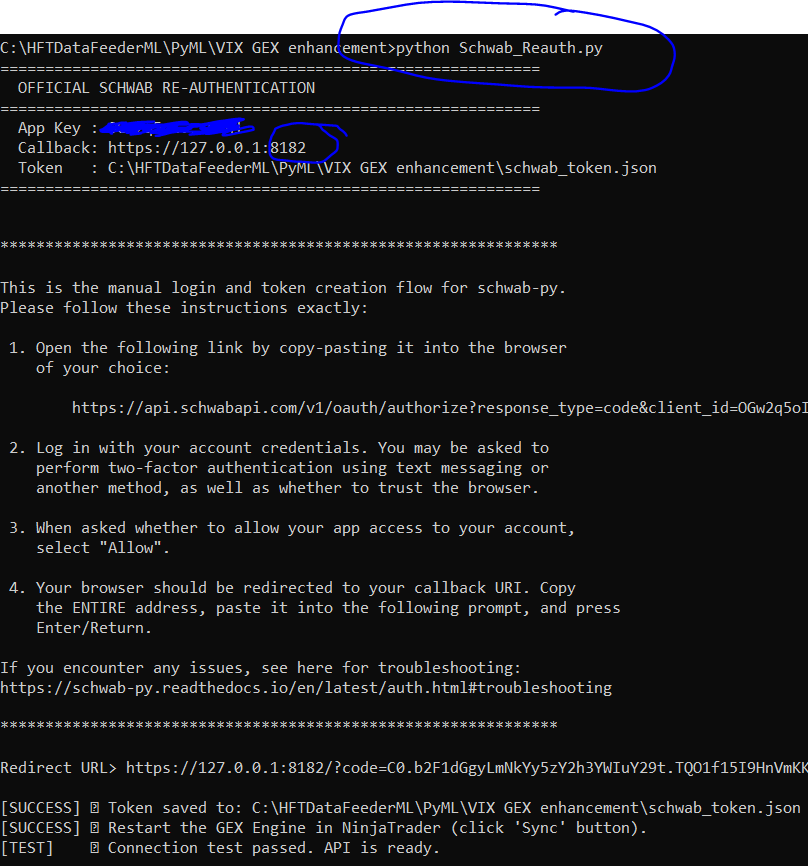
Reauthentication of keys : kimsam has provided a reauth py script, use it. First you have to make sure follow his instructions on setting up the env file with the API key, secret and callback URL. then run the py script without any arguments, it will open a browser to authenticate, once done you will get a redirect failed weblink, copy the url and paste back to the py terminal, it will get authenticated and token will be created. Usually the token good for a week.

-
Install the python and all packages in the requirements.txt file, Get Schwab API key, secret and ensure the call back url is correct. This one is the difficult of all the things and just follow schwab link and documentation shared by kimsam. Now add the indicator shared by kimsam and ensure the parameters are correctly configured/filled. It will work like a charm. Do do this all some experience with python is required to trouble shoot in case some issue.
-
Thanks for sharing a good website. They have lots of information on GEX. The NT script that can be downloaded from this site can be used with manual pull of GEX levels off course it is either end of day or delayed by a day. Subscription is needed for this for any other use.
-
@kimsam what prep we have to do to install your share when you post it ? Do we have to subscribe to LLM like Gemini mentioned earlier ?
-
@kimsam Can you please post the latest kimsamgex when you get time. Thanks
-
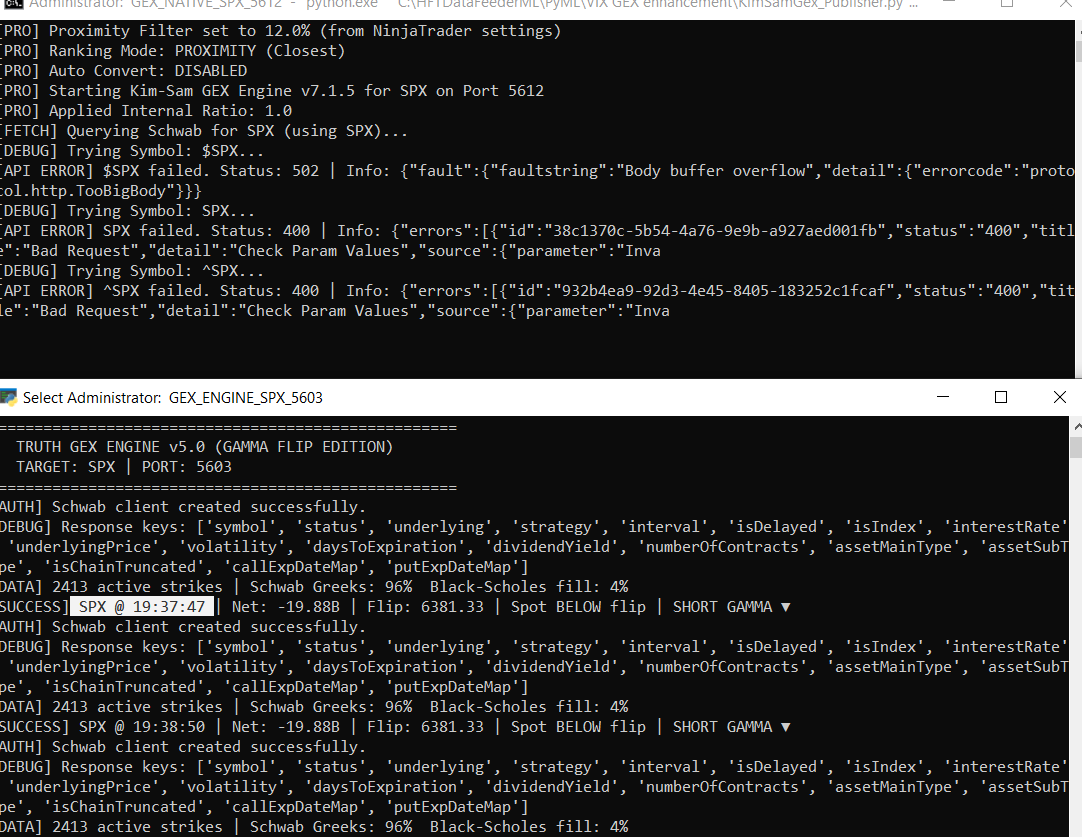
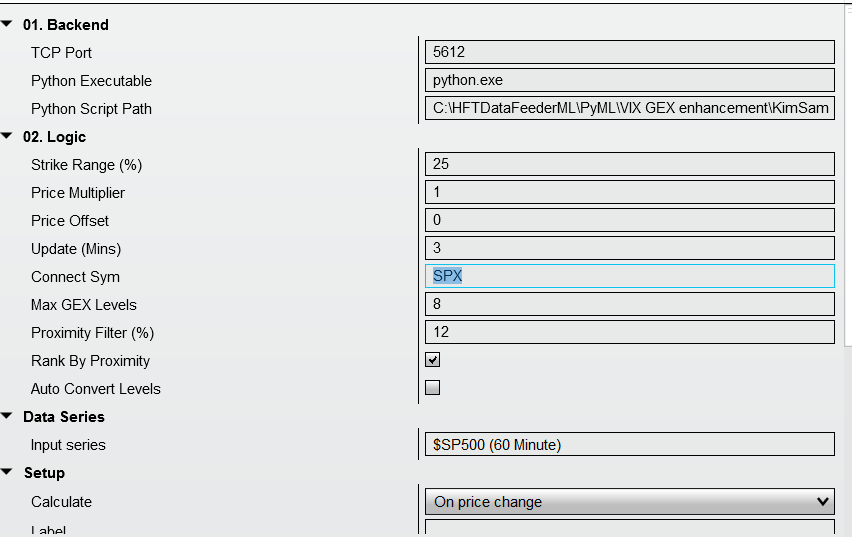
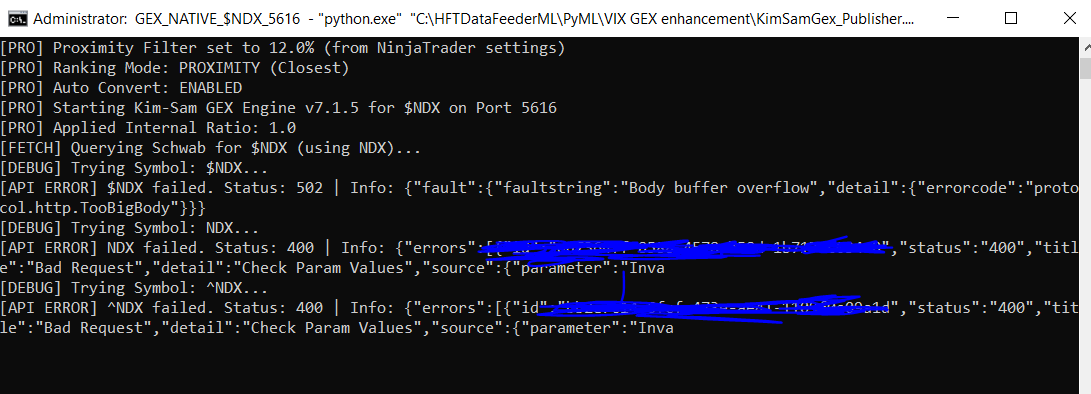
@kimsam SPX charts with old and new versions. Old version works perfectly, schwab fetches SPX option chain ( I think it is not fetching spy, you can verify in code). The new version, auto convert is false, price multiplier is 1, connect symbol is SPX. The fetch of SPX fails. Can you check why ? my guess is due to return code of 400, the API call in the latest version of code might have an issue. I checked with NQ similarly, I see the same issue. NDX also same issue.
-
@kimsam pl use a free LLM like olluma with a local LLM engine.
-
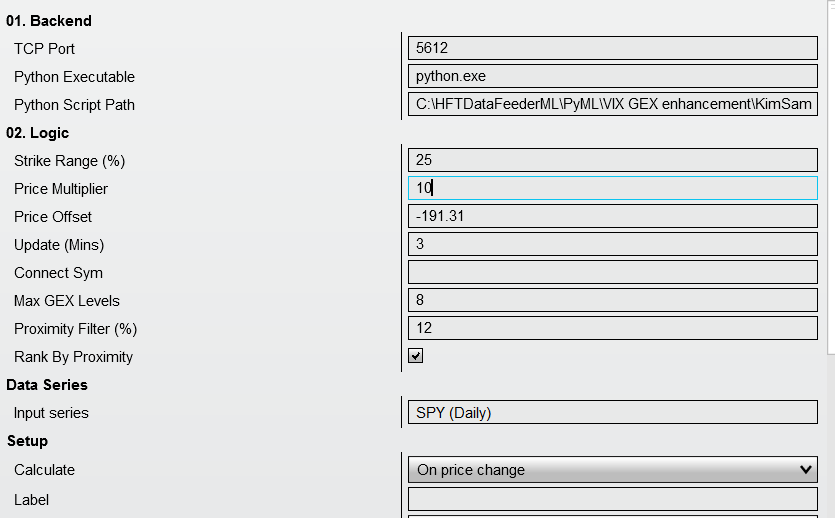
I think one important decision to make is For nq and es futures we have to do autoconvert, the symbols to be used are SPY and QQQ. For any other instrument, we have to use it directly in schawab to see if we get the option chain, if not we have to map to a closet ETF option chain stored in a internal table/array. this is with no autoconvert flag in the NT indicator parameters. Giving price multiplier and offset without autoconvert flag will be misleading. all thee or none imo.
-
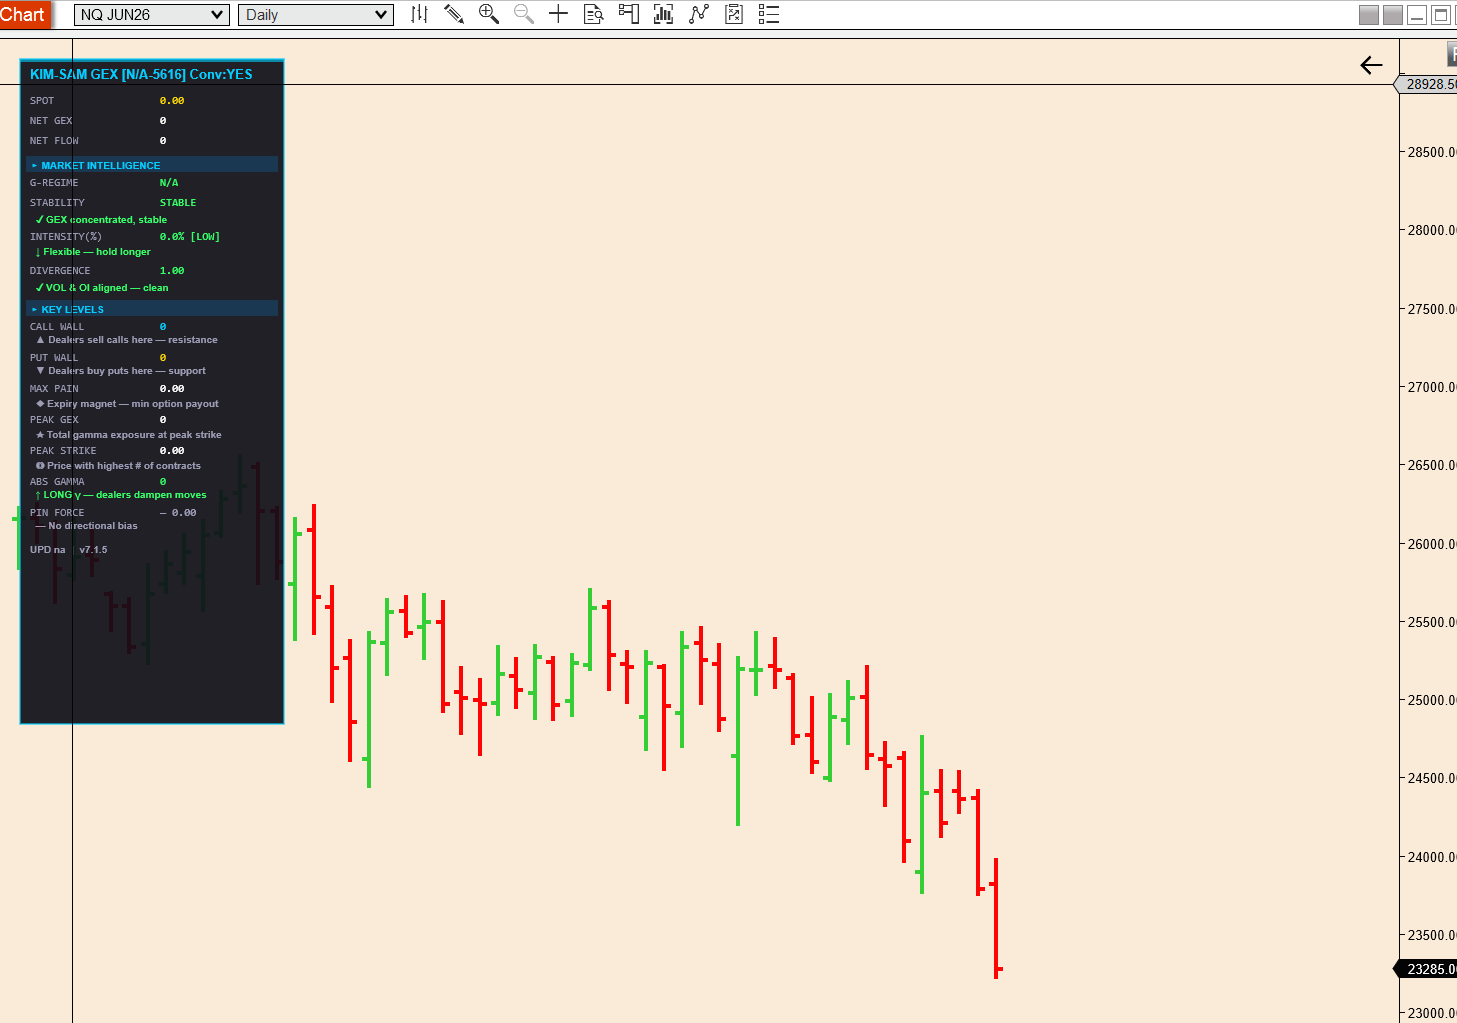
nq chart with connect symbok $NDX ; price multiplier is 1 offset is 0.
-
NQ chart and connect symbol is blank. Rest defaults (price multiplier is 10 defaults). Truth engine uses QQQ to get option chain and convert, but spot price is wrong in dashboard. I dont see the put and call and flip etc.
-
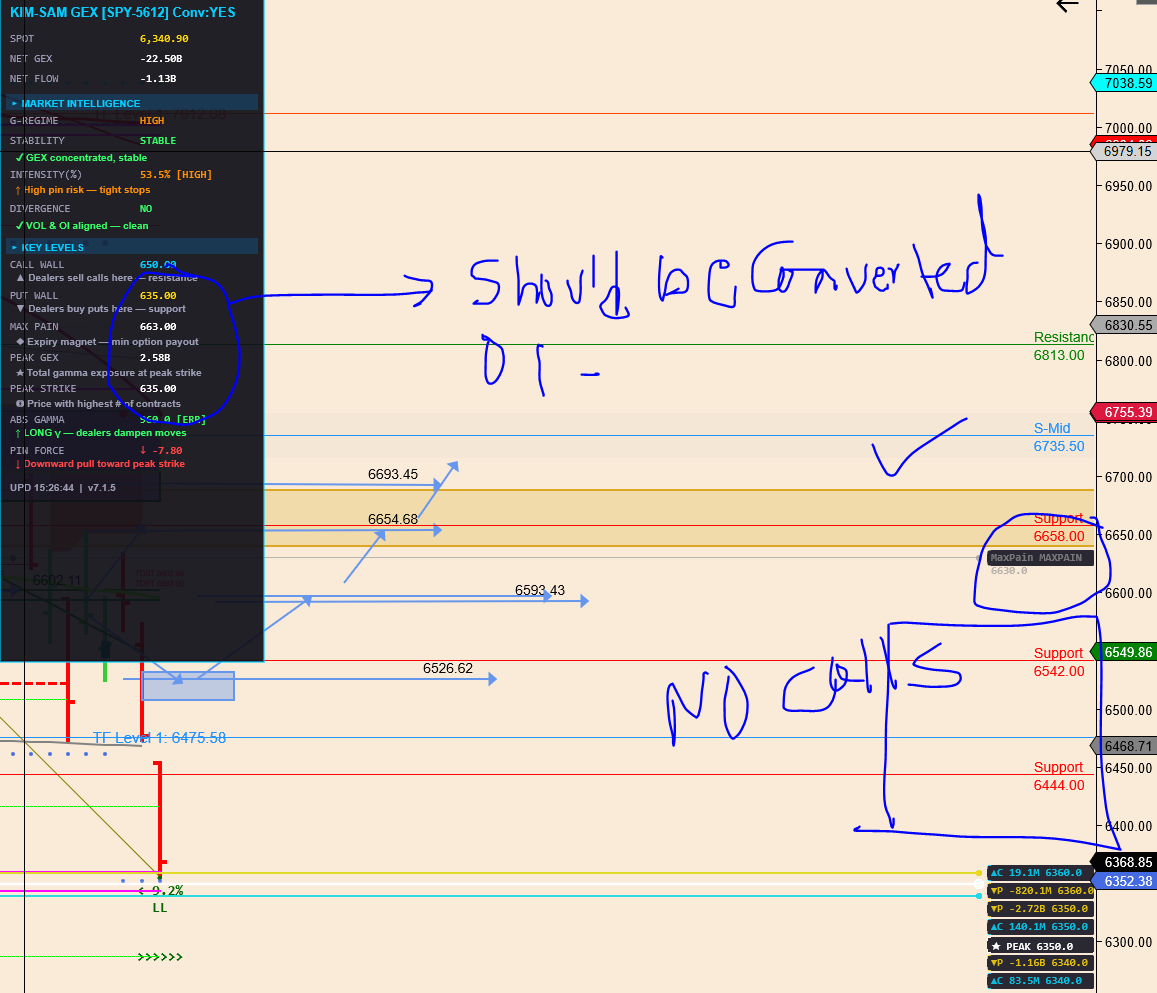
SPY chart and connect symbol is blank, price multiplier is 1 and offset is 0. convert = yes in dashboard (maybe it has to be NO)
-
SPX chart with SPY as connect symbol and rest defaults. dashboard says convert = yes
-
I have used the corrected cs file you uploaded and replaced the old one. The above results are with the uploaded cs file
-
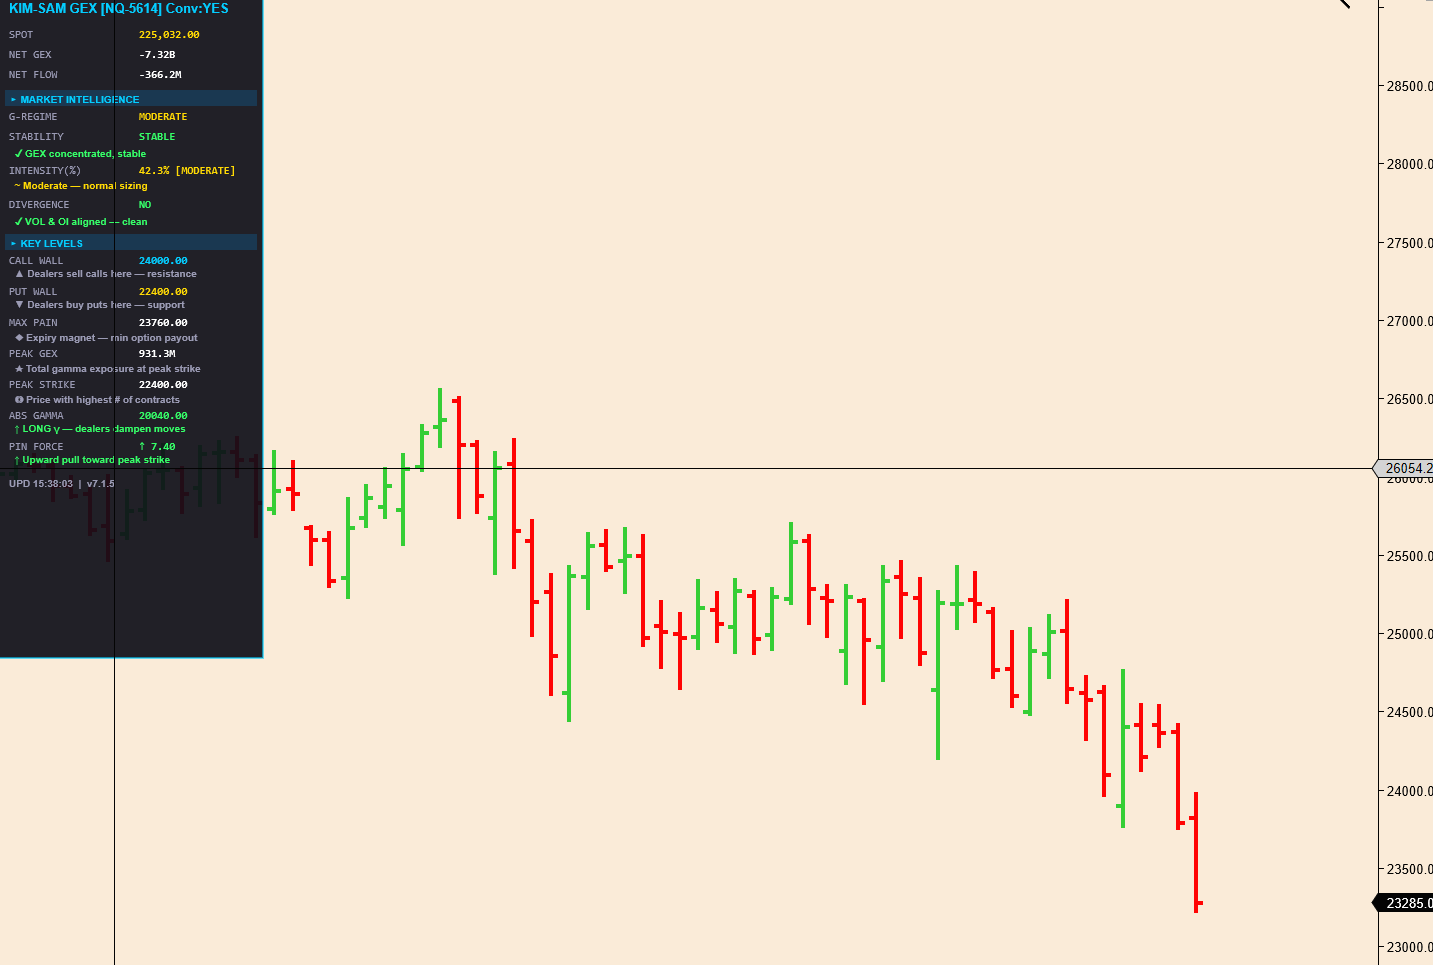
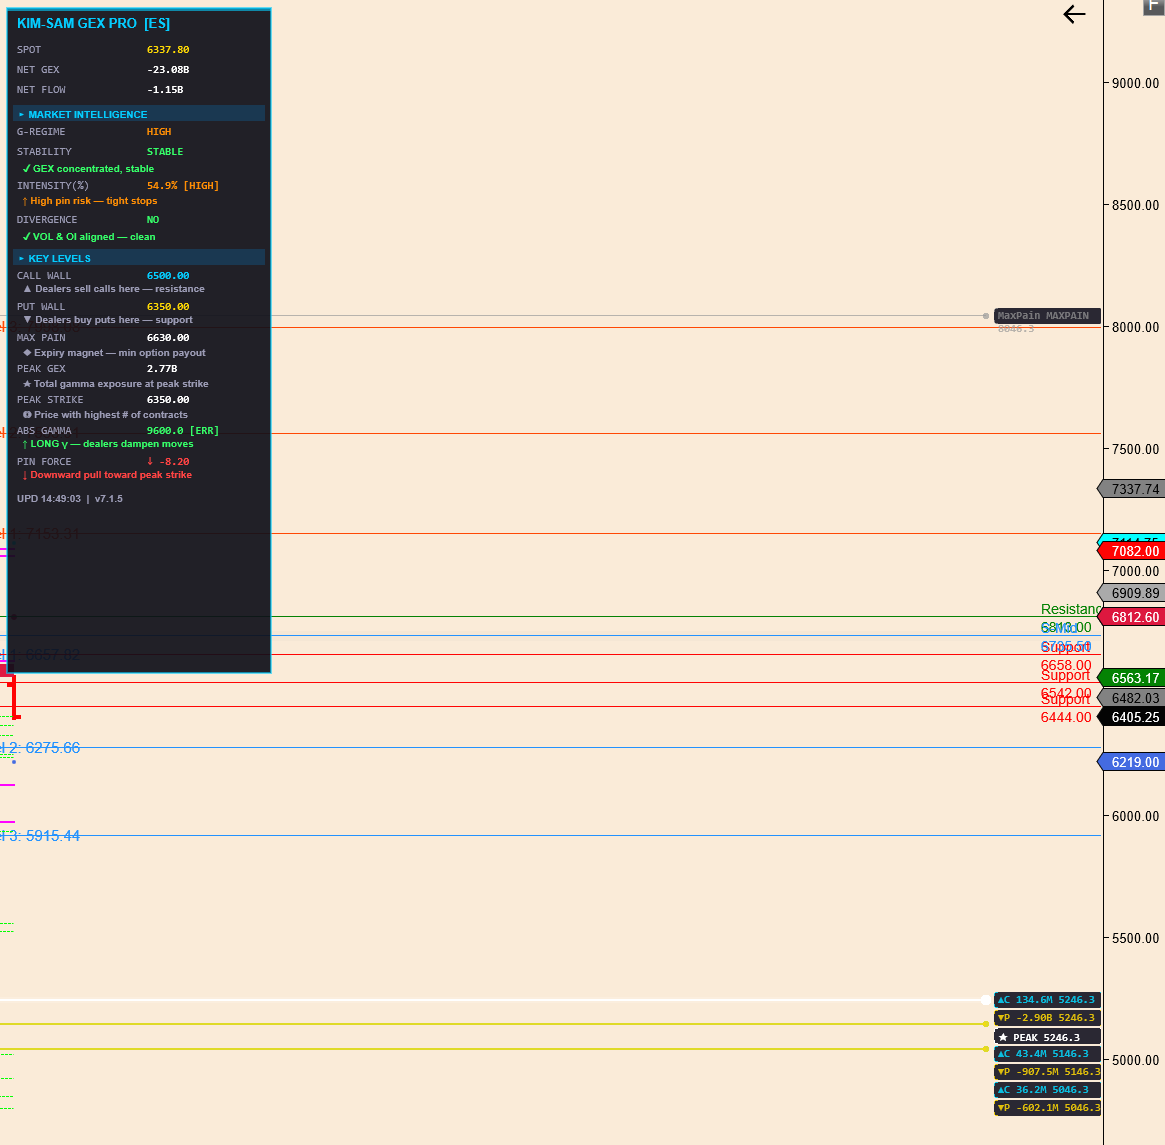
ES chart connect symbol blank, price multiplier is 1 or 10. dashboard shows correctly. but levels on charts are again too off for GEX, strike range is 10% offset shown is -58253.75
-
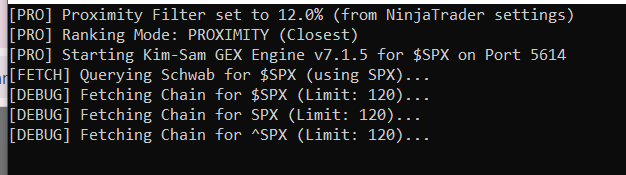
for spy chart with connect symbol blank, price multiplier 1 or 10 does not make a difference, dashboard looks like divided by ten or decimal position needs to be shifted to the right. Looks like display issue. offset always shows -191.11 on a SPX chart withconnect symbol set to SPY and price multiplier 10, offset shows as 3820.79 and dashboard shows 63.48 (either two decimals shift or it is dividing spy by 10). On a spx chart with connect symbol set to SPX price multipler 1 or 10; the py script tries spy first then starts trying alternate ones like spx ^spx $spx etc. the option chain never gets fetched even if strike range is reduced. the 502 error or indication of api call status is not output in the py console.
-
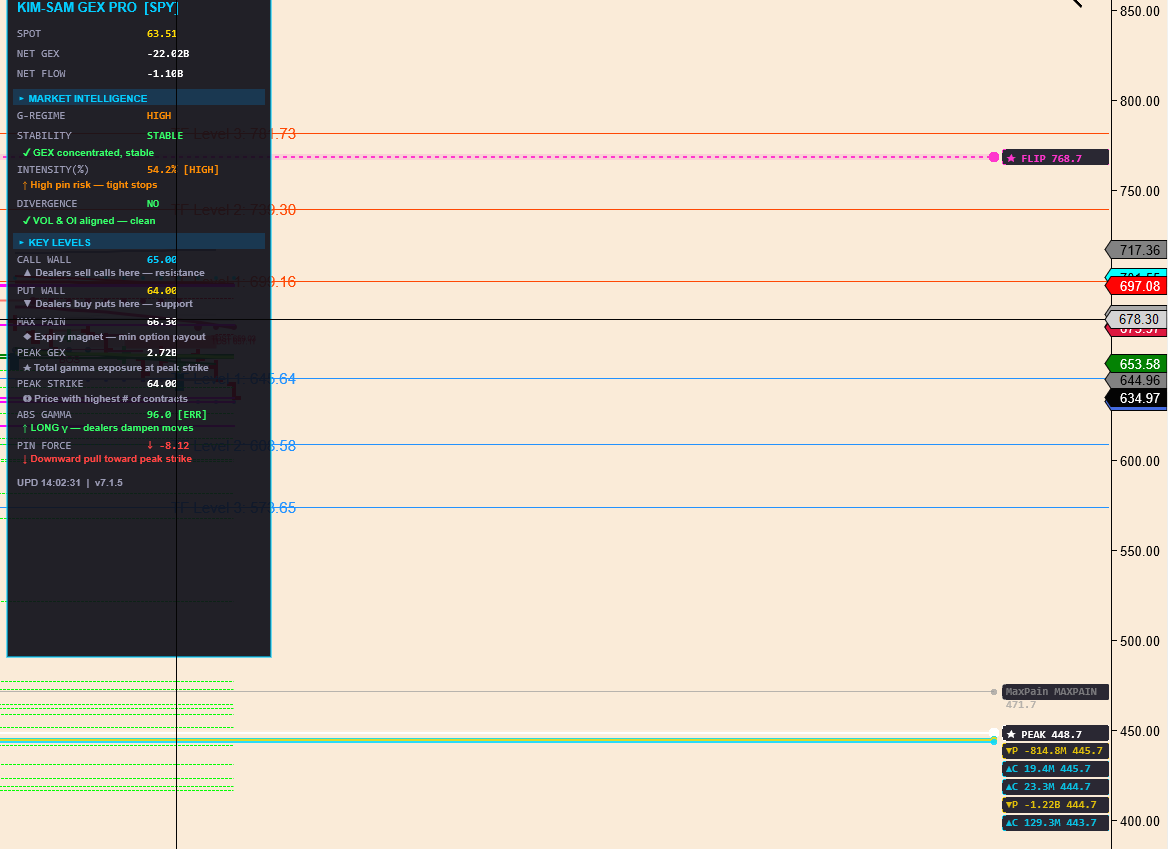
@kimsam This is spy chart with symbol blank ; we have a catch 22 situation, price multiplier is actually dividing in the dashboard. the lines on chart not sure if they are correct either. spy cannot have a peak flip of 448. do you get the same if on a spx chart I add the indicator with symbol SPY, even if the price multipler is 10, it divides it on the dashboard and does not shows the levels converted to 63xx range for spx. Since the auto convert flag is not there, there is ambugity of what price offset field does without this auto convert flag. Please check this. Dashboard should in header say SPY-53011 port; currently port is missing and convert levels flag status somewhere Convert : Yes or No. One more thing I noticed, if I want to change the price offset from the indicator parameter maintennace window, it keeps coming back again even if I wipe it off using backspace. I am not sure why In previous version the we have P # 1 and say C #1 in this version we dont see a number after P and C . Now are these just some high concentraction of GEX or irrespective of puts or calls we want to name them as GEX 1, GEX 2, GEX 3, GEX 4 that denote the highest to lowest of exposure. This question I had posed earlier in one of my posts. We need to know what the P and C levels are on the chart and what do they denote. In the dashboard GEX ratio or something like that is needed. as the absolute call‑gamma versus put‑gamma ratio.
-
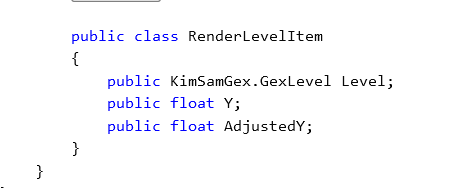
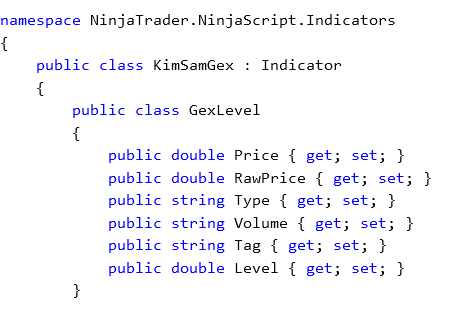
Maybe you have forgotten to include GexLevel.cs or a class definition ? @kimsam To get around this I changed SchwabGEXPro to KimSamGex and added in the class attribute level as a double
-
Any chance of update today before market close to test ?