⤴️-Paid Ad- Check advertising disclaimer here. Add your banner here.🔥
All Activity
- Past hour
-
 @Ninja_On_The_Roof
 -
 ⭐ ajeet reacted to a post in a topic:
NINZA INDIES - FREE OF CONSUSION - FRUSTRATION - HEADACHES - TIME
⭐ ajeet reacted to a post in a topic:
NINZA INDIES - FREE OF CONSUSION - FRUSTRATION - HEADACHES - TIME
-
⭐ ajeet reacted to a post in a topic:
Market Replay Downloader
-
⭐ ajeet reacted to a post in a topic:
Affordable Indicators - Accounts Dashboard Suite
-
Do what kimsam said or add an info file and make a zip like this. Simply import it as usual https://workupload.com/file/Qr88aDgvCQY
-
⭐ ajeet reacted to a post in a topic:
John Grady's NO BS Day Trading course
- Today
-
⭐ RichardGere reacted to a post in a topic:
NINZA INDIES - FREE OF CONSUSION - FRUSTRATION - HEADACHES - TIME
-
⭐ RichardGere reacted to a post in a topic:
NINZA INDIES - FREE OF CONSUSION - FRUSTRATION - HEADACHES - TIME
-
⭐ RichardGere reacted to a post in a topic:
NINZA INDIES - FREE OF CONSUSION - FRUSTRATION - HEADACHES - TIME
-
⭐ RichardGere reacted to a post in a topic:
Affordable Indicators - Accounts Dashboard Suite
-
 Hello, Add these to your list. Zenith DOM Sonarlike Iceberg Finder VolumeTankArmy *Important: For VolumeTankArmy: this is the only time you need to click "YES" to replace Resource file. https://workupload.com/archive/aBHJMCtMrZ
 -
Traderbeauty reacted to a post in a topic:
NINZA INDIES - FREE OF CONSUSION - FRUSTRATION - HEADACHES - TIME
-
XandarT reacted to a post in a topic:
Build a Footprint
-
Latest one: https://workupload.com/file/sVTstd9P5Ut
-

Affordable Indicators - Accounts Dashboard Suite
Minigems replied to ScoobyDoo's topic in Ninja Trader 8
This educated version is 25.10.30 so newer than the one you posted but it is not the latest. https://workupload.com/file/Lf5TrmntEBt -

lastest version predator traesaber version 3.6.0.0.0 need to edu
RamAli replied to TRADER's topic in Ninja Trader 8
Somebody has the NinzaPullback Indicator? -
Hello, Add another 3 to the list. These 3 should also get along with the rest of the Ninza Indicators Pack. RomantikPulse ImbalanceVolume Sensor ApexFlow Zignal https://workupload.com/archive/dYM3nCwaVR
-
fixed errors couldnt import working on 8.1.5.2 64-bit import from control center you should see the addon under tools MultidayReplayDownloader_FINAL.zip
-
which footprint indicator is this?
-
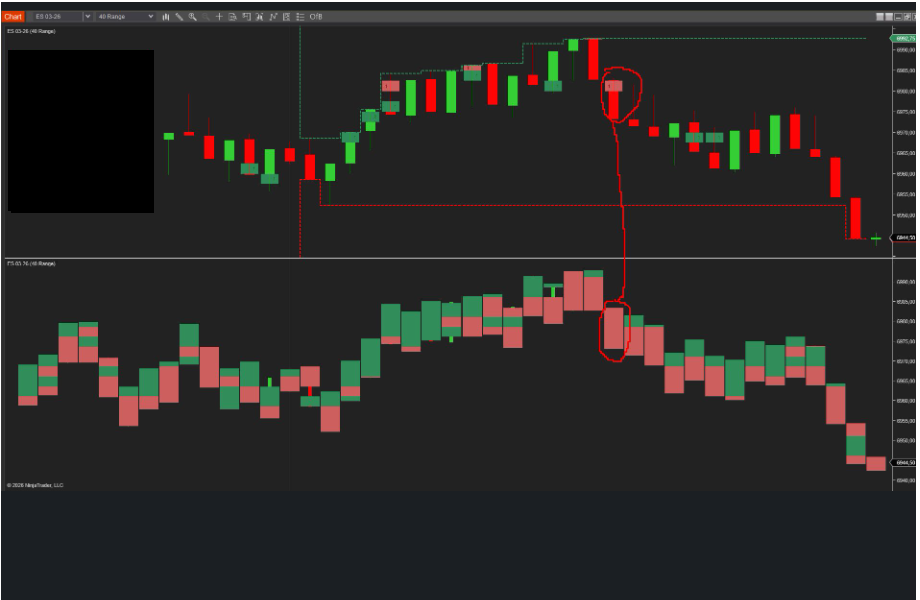
When a full red candle appears on first chart → that’s our sell trigger. But if, inside that same candle, first Footprint shows the largest institutional seller footprint, the signal becomes extremely powerful. Not just a visual pattern. Not just momentum. But confirmed aggressive institutional pressure. Candle direction + Largest seller footprint alignment = 90% probability zone. This is not random flow. This is controlled distribution.
-

A new diamond in the rough- a very good educator
Traderbeauty replied to Traderbeauty's topic in Ninja Trader 8
Dont worry- i will contact him and make sure that everything is settled. -
@kimsam @apmoo @N9T @redux Can you help us to unlock the Qkronos https://workupload.com/file/hwE9Kq9JmG4

-
Jut but it in bin/ coustom and restart
-
https://workupload.com/file/25Bb4t4bXCL
-

A new diamond in the rough- a very good educator
⭐ Carlos5 replied to Traderbeauty's topic in Ninja Trader 8
A few days ago I bought Bookmap from him, He delivery Version 7.5 with incomplete indicators, Mostly when in his webpage he said BookMap V7.6. I try to contact him for few days and he cant answer anything. -
Hi @kimsam, I managed to get the password working but the file you shared is just a dll... can you send the full zip archive
-
What's the license key for NQ ultra
-
it is password protected @kimsam
- Yesterday
-
Welcome to Indo-Investasi.com. Please feel free to browse around and get to know the others. If you have any questions please don't hesitate to ask.
-
 ysewellam79 joined the community
 -
pocket option has no problems taking us residents.
-
 kingmob6 joined the community
 -
bump
-
test it please .. and confirm if works .. https://workupload.com/file/C7eGVMJxf5D
-
it's better to import it like any other ninja zip file