⤴️-Paid Ad- Check advertising disclaimer here. Add your banner here.🔥
All Activity
- Past hour
-
Unfortunately, I also had a lot of trouble with version 2, and it didn't work well for me either. I use version 1.6 offline.
- Today
-
Ok, Glad to see Optuma works at your end. It does not work at my end. Earlier i was able to make it run, but exact steps etc not noted and no longer it works at my end something i am not following exactly. I guess, first installing 1.6 and later upgrade to version 2 could make it possible, but i am bit scared now to keep experimenting on my new PC
-
Dear friend, I just saw your message.I haven't been around for quite a while. Yes, we are still interested in purchasing. However, if one more person joins us, we will proceed with the purchase immediately and close this Topic.
-
Hello, I was waiting for someone to make a purchase on that site, but no purchase has been made yet. The downside of this site is that even if we had paid months ago, we would still be waiting; in fact, our money might remain on the site for several more months. There are three of us now, and each person needs to pay $10.42. Does anyone have any ideas on how to handle this purchase? Is there anyone who could register on the site so that I can transfer the funds to their wallet (Tether USDT )? @monkeybusiness @HappyHarry3
-
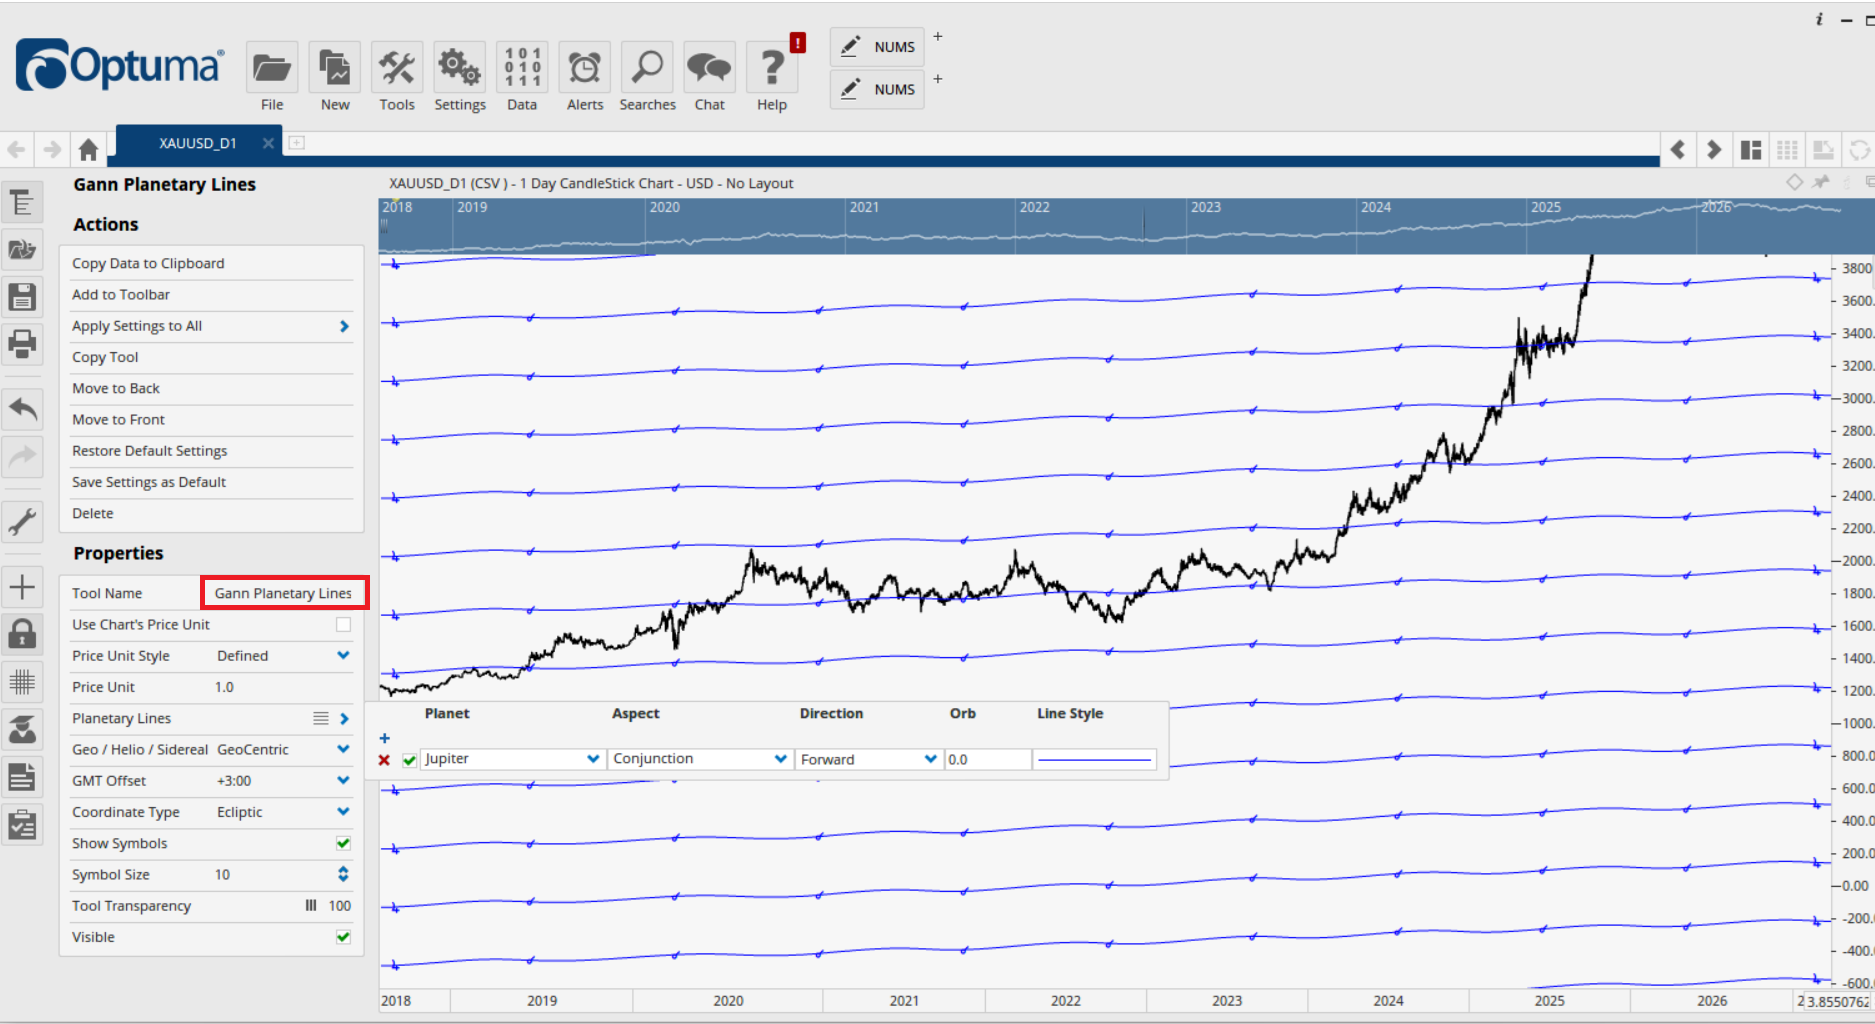
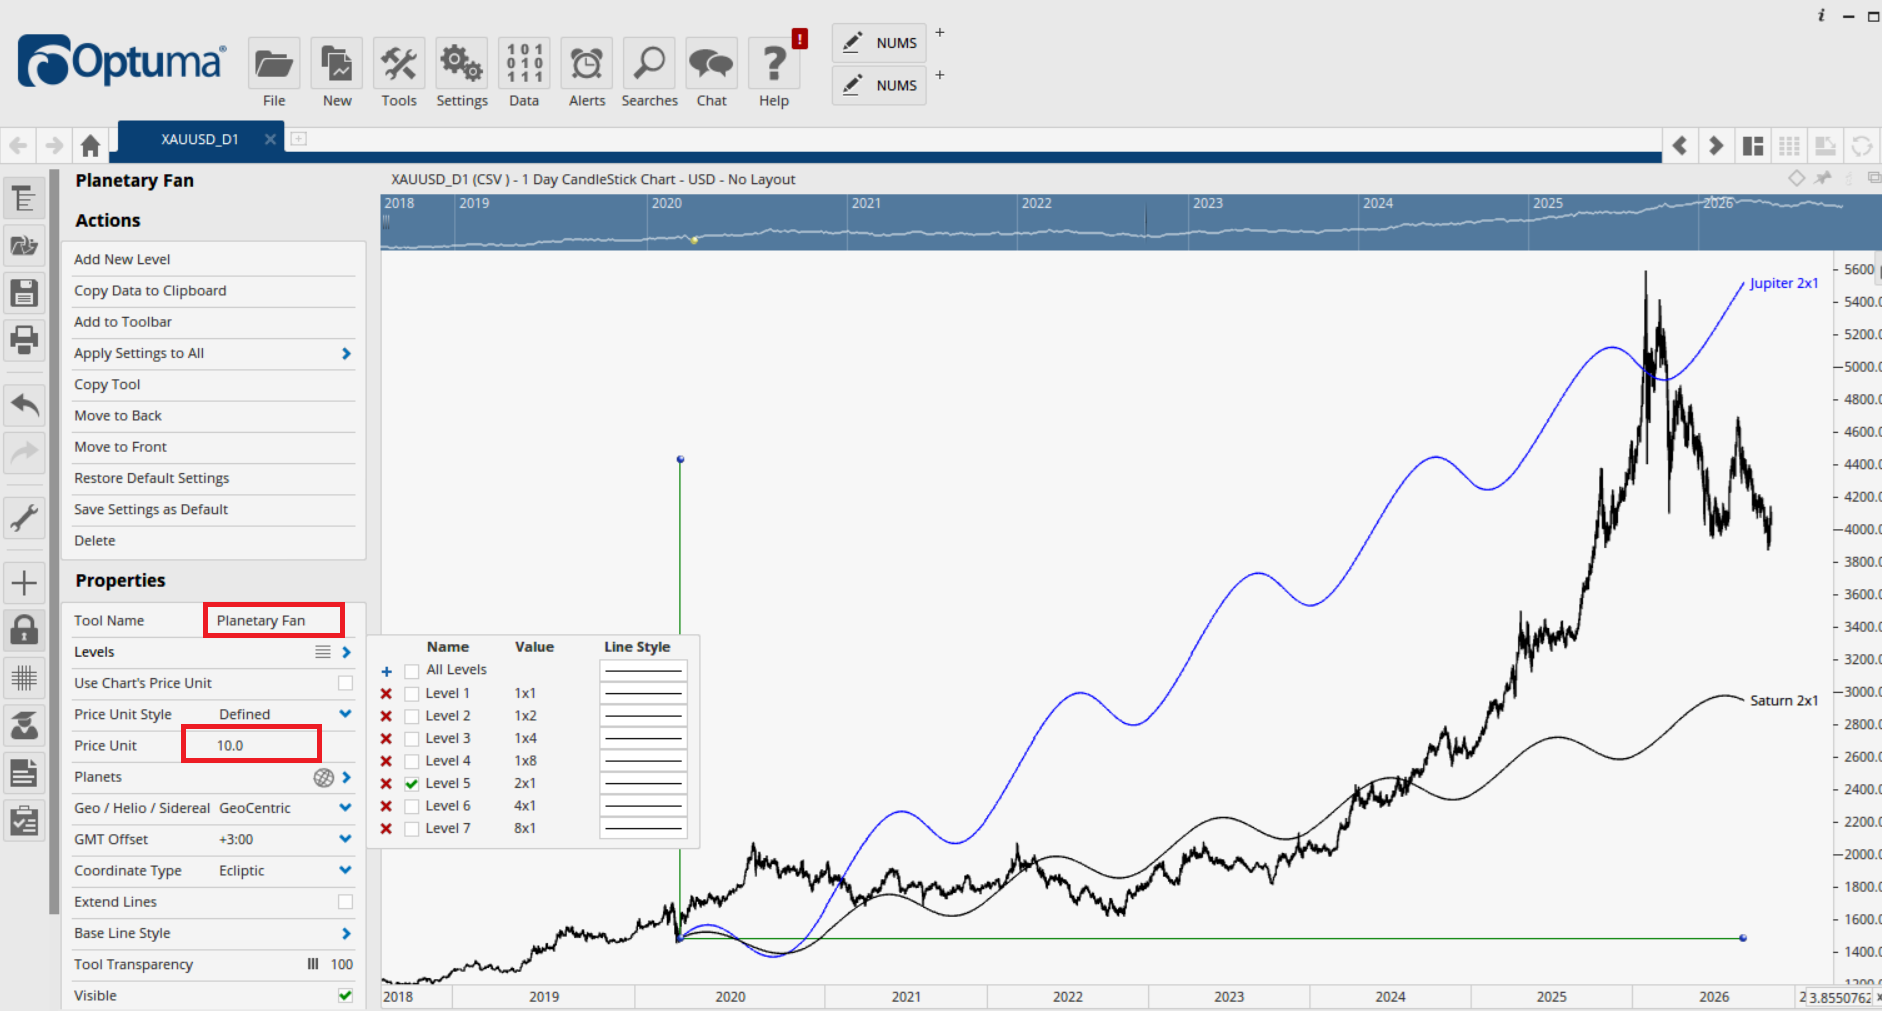
Dear friend FFRT , thank you very much; that was very kind of you. Galactic Trader is very difficult to use; you have to input MetaStock data, and I couldn't find anything in the software's manual regarding the relationship between the prices and the longitudinal positions of the planets. Furthermore, there is no feature by the name of "Londitude Angle " in the software Optuma—only the items listed below (Gann planetary line /Planetary Fan )—none of which include calculations for the interaction between two planets (like jupiter/saturn Average (See the first image in the post.) . It seems to me that Optima lacks the capability to generate this "Mikula" chart pattern, though it is possible that I am simply not well-informed enough. If any of you happen to find out more about this in the future, please post a message here. Thanks

-
Also check Galactic Trader https://www.4shared.com/zip/tDVf0IhS/Fibonacci_Galactic_Trader_40_R.html When Optuma 1.6 was shared by someone, that RE had also shared the latest Fibonacci Galactic Trader also
-
 Dunmiji01 joined the community
-
 Dunmiji joined the community
-

VIP Membership - FREE upgrade for OLD and ACTIVE Members
Traderbeauty replied to MrAdmin's topic in Announcements
approve enjoy jane -
VIP Membership - FREE upgrade for OLD and ACTIVE Members
Traderbeauty replied to MrAdmin's topic in Announcements
approve enjoy jane - Yesterday
-
VIP Membership - FREE upgrade for OLD and ACTIVE Members
Traderbeauty replied to MrAdmin's topic in Announcements
approve enjoy jane -

VIP Membership - FREE upgrade for OLD and ACTIVE Members
⭐ setare replied to MrAdmin's topic in Announcements
Dear @Traderbeauty Please, if possible, include add me to the VIP too. Thanks -
I couldn't find the specific indicator used to plot this type of chart, even in the version dear FFRT sent. However, this indicator is somewhat similar. https://www.tradingview.com/script/EksWr4T1-Price-and-Longitude-Angles/
-
 noah joined the community
-
 koko joined the community
-
 ⭐ rtt518 changed their profile photo
-
 ABDS joined the community
-

VIP Membership - FREE upgrade for OLD and ACTIVE Members
⭐ david replied to MrAdmin's topic in Announcements
Hi, @Traderbeauty! Can you please add me to the VIP too? 🥰 -

VIP Membership - FREE upgrade for OLD and ACTIVE Members
⭐ pratap replied to MrAdmin's topic in Announcements
sir please give me accesss to vip vault, thanking you. -

VIP Membership - FREE upgrade for OLD and ACTIVE Members
⭐ hmsas replied to MrAdmin's topic in Announcements
@Traderbeauty can you kindly add me to the vip group >> i am here for 3 years .. thank you - Last week
-
VIP Membership - FREE upgrade for OLD and ACTIVE Members
Traderbeauty replied to MrAdmin's topic in Announcements
approved enjoy jane -
VIP Membership - FREE upgrade for OLD and ACTIVE Members
Traderbeauty replied to MrAdmin's topic in Announcements
approved enjoy jane -

VIP Membership - FREE upgrade for OLD and ACTIVE Members
jamiepark replied to MrAdmin's topic in Announcements
plz add me -
 AI stocks crashed Wall Street. Where will #NQ100 stop? The US market rally after the elections lasted only one session. On November 5, investors began selling off shares of chip and server manufacturers, and the decline soon spread to the broader market. #NQ100 plunged to the vicinity 26,300 points and bounced back to 26 900. The benchmark indices for #SP500 and #DJI30 ended the US session with declines of 4,4% and 3,4% respectively. At the end of October, we wrote that renewed interest in AI had helped US indices bounce back. At that time, investors were encouraged by strong cloud business results and clearer timelines for return on investment. Now, the market has to reassess how quickly data centers will be built and when suppliers will receive orders that investors are already counting on. FreshForex's Birthday continues! To celebrate our 22nd anniversary, we are offering: Swap-free trading until the end of the month! A 220% drawdown bonus from $220! Double cashback — up to $40 per lot! Why Congressional elections hit AI stocks Democrats secured a majority in both chambers of Congress. On Wednesday, the broad market reacted to the election results with gains, but on Thursday attention shifted to what the change in majority might mean for the AI industry. Investors began factoring in the risk of stricter regulation on data center construction. One contentious issue is the strain on power grids. If approval for new sites drags on, some orders for chips, servers, and networking equipment may be pushed back. This is particularly critical for companies whose stock prices have already priced in rapid supply growth. Reports fuel the sell-off Fresh results from Qualcomm and Arm added reasons to sell. Qualcomm's quarterly revenue from smartphone chips fell by 26% year-over-year and came in below forecasts. Arm reported record total revenue, but received $670 million in royalties for the use of its technologies against expectations of around $721 million. Equipment buyers have their own problem. Alphabet's cloud revenue more than doubled for the quarter, yet the company's free cash flow was negative at $9.1 billion. One of the main reasons was large investments, and the company expects further growth in capital expenditures in 2027. Even with strong demand, investors have to wait longer for a return on these expenses. Which stocks lost the most By the close of US exchanges, basic shares #Micron and #AMD lost 17,5% and 17,3%. Next were #Marvel (−16,4%), #Dell (−15,0%), #AppliedMat (−13,6%), #Arm (-13.1%) and #NVIDIA (-9.3%). At #Micron there was also a separate reason for the decline. According to Bloomberg, the company suspended its factory project in Taiwan due to a prolonged labor dispute. According to analysts' estimates FreshForex, in the next few sessions #NQ100 may once again drop to 26,300 points. If chip manufacturers' stocks fail to recover even part of their losses, pressure on the index will intensify, and it risks falling below this level. In celebration of our Birthday, we have completely waived swaps! Deposit at least $220, activate promo code FF22 in your Client Area, and trade without swap fees!
-
Welcome to Indo-Investasi.com. Please feel free to browse around and get to know the others. If you have any questions please don't hesitate to ask.