All Activity
- Past hour
-
 ⭐ nadjib reacted to a post in a topic:
WOLFE WAVE
⭐ nadjib reacted to a post in a topic:
WOLFE WAVE
-
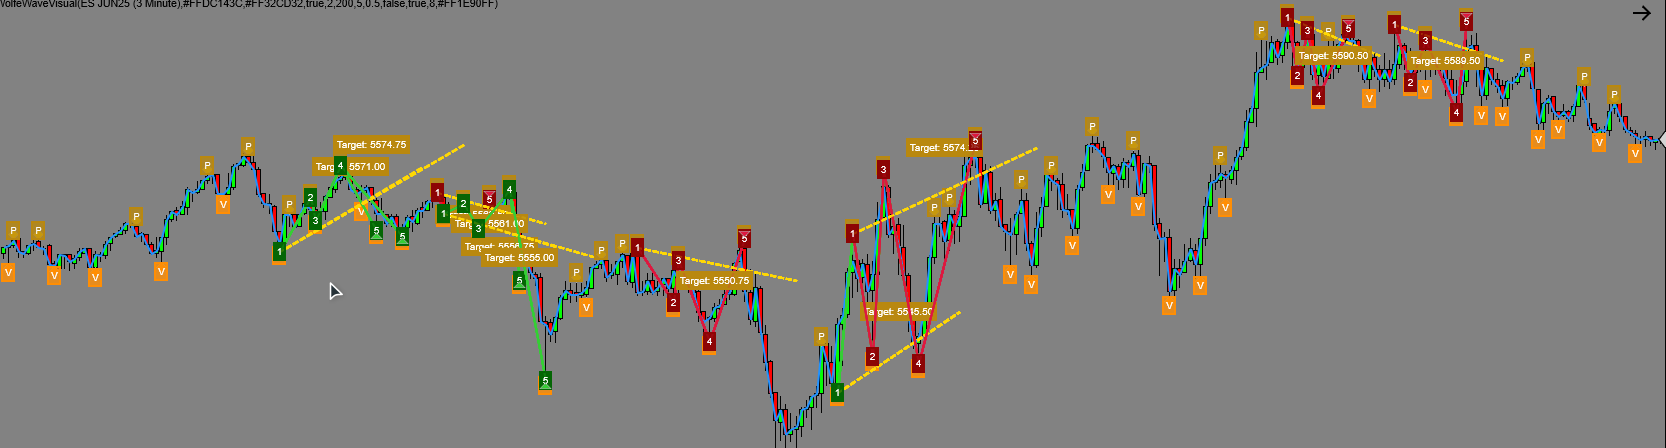
WolfeWaveVisual Indicator - User Manual Overview The WolfeWaveVisual indicator is designed to automatically identify and display Wolfe Wave patterns on your NinjaTrader 8 charts. This implementation features enhanced visualization, flexible detection parameters, and real-time alerts. Key Features Automatic Pattern Detection: Identifies both bullish and bearish Wolfe Wave patterns Clear Visual Markers: Highlights each swing point with diamonds and numbered labels ZigZag Visualization: Shows the underlying price structure used for pattern detection Target Price Projection: Calculates and displays potential price targets based on pattern geometry Configurable Parameters: Adjust sensitivity and visualization to suit different markets and timeframes Debug Mode: Provides detailed information about pattern detection process Real-time Alerts: Notifies you when new patterns form Parameter Settings Parameter Description Recommended Range FractalStrength Number of bars on each side to confirm swing points 2-5 MaxLookback Maximum number of bars to analyze for patterns 100-500 PatternTolerance Flexibility in pattern validation (higher = more patterns) 0.3-0.7 MinPointsForPattern Minimum number of swing points before pattern checking 5-10 ShowAllPoints Display all detected zigzag points True ShowTargetProjection Display target price projection lines True DebugMode Show detailed debug information True (initially) Color Settings Setting Description BullishColor Color for bullish Wolfe Wave patterns BearishColor Color for bearish Wolfe Wave patterns ZigZagColor Color for the zigzag connecting swing points Pattern Identification The indicator identifies two types of Wolfe Wave patterns: Bullish Wolfe Wave Forms during downtrends Consists of 5 points (3 valleys and 2 peaks) Point 5 is lower than point 3 Points 1-3 and 2-4 converge Potential buying opportunity at point 5 Bearish Wolfe Wave Forms during uptrends Consists of 5 points (3 peaks and 2 valleys) Point 5 is higher than point 3 Points 1-3 and 2-4 converge Potential selling opportunity at point 5 Troubleshooting Issue Solution No patterns detected Increase PatternTolerance, decrease FractalStrength Too many false patterns Decrease PatternTolerance, increase FractalStrength ZigZag lines missing Ensure ShowAllPoints is enabled No visual elements Check that the indicator is applied to price panel Tips for Best Results Use on higher timeframes (H1, H4, Daily) for more reliable patterns Combine with volume analysis and support/resistance levels Start with DebugMode enabled to understand detection process Adjust FractalStrength based on market volatility Consider patterns more reliable when they align with the overall trend Technical Notes Indicator recalculates on each new bar Pattern detection uses a zigzag-based approach Target prices are calculated using projection of line 1-3 Alerts trigger once when a pattern is first detected
-
 iamhktr joined the community
 -
 yc1 reacted to a post in a topic:
WOLFE WAVE
yc1 reacted to a post in a topic:
WOLFE WAVE
-
Looking how perfect it just nailed this move down. Both indies were in synchronization. https://limewire.com/d/ucK14#3i6GG0k3lP Just to be clear though, I am not promoting nor I am recommending anything here nor your results or outcomes would be the same as mine. Just sharing my thoughts.
-
HERE AN UPDATE #region Using declarations using System; using System.Collections.Generic; using System.ComponentModel; using System.ComponentModel.DataAnnotations; using System.Linq; using System.Text; using System.Threading.Tasks; using System.Windows; using System.Windows.Input; using System.Windows.Media; using System.Xml.Serialization; using NinjaTrader.Cbi; using NinjaTrader.Gui; using NinjaTrader.Gui.Chart; using NinjaTrader.Gui.SuperDom; using NinjaTrader.Gui.Tools; using NinjaTrader.Data; using NinjaTrader.NinjaScript; using NinjaTrader.Core.FloatingPoint; using NinjaTrader.NinjaScript.DrawingTools; using NinjaTrader.NinjaScript.Indicators; #endregion namespace NinjaTrader.NinjaScript.Indicators { public class WolfeWaveVisual : Indicator { #region Variables private List<WolfePoint> peakPoints = new List<WolfePoint>(); private List<WolfePoint> valleyPoints = new List<WolfePoint>(); private int lastProcessedBar = 0; private bool isDebugMode = false; private int patternCount = 0; private class WolfePoint { public int BarIndex { get; set; } // Índice de la barra public double Price { get; set; } // Precio del punto public DateTime Time { get; set; } // Tiempo asociado public bool IsPeak { get; set; } // Si es pico (true) o valle (false) public WolfePoint(int barIndex, double price, DateTime time, bool isPeak) { BarIndex = barIndex; Price = price; Time = time; IsPeak = isPeak; } } private class WolfePattern { public WolfePoint Point1 { get; set; } public WolfePoint Point2 { get; set; } public WolfePoint Point3 { get; set; } public WolfePoint Point4 { get; set; } public WolfePoint Point5 { get; set; } public bool IsBullish { get; set; } public double TargetPrice { get; set; } } #endregion #region Properties [NinjaScriptProperty] [Range(1, 10)] [Display(Name="Fractal Strength", Description="Number of bars on each side to confirm fractals", Order=1, GroupName="Parameters")] public int FractalStrength { get; set; } [NinjaScriptProperty] [Range(1, 500)] [Display(Name="Max Lookback Bars", Description="Maximum number of bars to look back for patterns", Order=2, GroupName="Parameters")] public int MaxLookback { get; set; } [NinjaScriptProperty] [Range(0.1, 1.0)] [Display(Name="Pattern Tolerance", Description="Tolerance for validating patterns (0.1-1.0)", Order=3, GroupName="Parameters")] public double PatternTolerance { get; set; } [NinjaScriptProperty] [Display(Name="Show All ZigZag Points", Description="Show all detected zigzag points", Order=4, GroupName="Visualization")] public bool ShowAllPoints { get; set; } [NinjaScriptProperty] [Display(Name="Bullish Pattern Color", Order=5, GroupName="Visualization")] public Brush BullishColor { get; set; } [NinjaScriptProperty] [Display(Name="Bearish Pattern Color", Order=6, GroupName="Visualization")] public Brush BearishColor { get; set; } [NinjaScriptProperty] [Display(Name="ZigZag Line Color", Order=7, GroupName="Visualization")] public Brush ZigZagColor { get; set; } [NinjaScriptProperty] [Display(Name="Triangle Size", Description="Size of triangles marking pattern completion", Order=8, GroupName="Visualization")] public int TriangleSize { get; set; } [NinjaScriptProperty] [Display(Name="Show Target Projection", Description="Show target price projection", Order=9, GroupName="Visualization")] public bool ShowTargetProjection { get; set; } [NinjaScriptProperty] [Display(Name="Min Points For Pattern", Description="Minimum number of zigzag points needed before checking patterns", Order=10, GroupName="Parameters")] public int MinPointsForPattern { get; set; } [NinjaScriptProperty] [Display(Name="Debug Mode", Description="Show additional information for debugging", Order=11, GroupName="Parameters")] public bool DebugMode { get; set; } #endregion protected override void OnStateChange() { if (State == State.SetDefaults) { Description = "Wolfe Wave Indicator with Enhanced Visualization"; Name = "WolfeWaveVisual"; Calculate = Calculate.OnEachTick; // Vamos a calcular en cada tick para mayor precisión IsOverlay = true; DisplayInDataBox = true; DrawOnPricePanel = true; DrawHorizontalGridLines = true; DrawVerticalGridLines = true; PaintPriceMarkers = true; ScaleJustification = NinjaTrader.Gui.Chart.ScaleJustification.Right; // Establecer valores predeterminados FractalStrength = 2; MaxLookback = 200; PatternTolerance = 0.5; ShowAllPoints = true; BullishColor = Brushes.LimeGreen; BearishColor = Brushes.Crimson; ZigZagColor = Brushes.DodgerBlue; TriangleSize = 8; ShowTargetProjection = true; MinPointsForPattern = 5; DebugMode = true; // Crear plots para asegurar que el indicador aparezca en el gráfico AddPlot(new Stroke(ZigZagColor, 2), PlotStyle.Line, "ZigZag"); } else if (State == State.Configure) { // No necesita configuración adicional } else if (State == State.DataLoaded) { // Inicializar variables peakPoints.Clear(); valleyPoints.Clear(); lastProcessedBar = 0; isDebugMode = DebugMode; if (isDebugMode) { ClearOutputWindow(); Print("WolfeWaveVisual: Inicializado con Fractal=" + FractalStrength + ", Lookback=" + MaxLookback + ", Tolerance=" + PatternTolerance); } } else if (State == State.Historical) { // Limpiar gráfico al empezar RemoveDrawObjects(); } } protected override void OnBarUpdate() { // Asegurarse de que tenemos suficientes barras para el análisis if (CurrentBar < FractalStrength * 2 + 1) return; // Actualizar plots para asegurar que el indicador se ve Values[0][0] = Close[0]; // Solo procesar una vez por barra if (lastProcessedBar == CurrentBar) return; lastProcessedBar = CurrentBar; // Detectar y almacenar picos y valles FindZigZagPoints(); // Mostrar ZigZag si está habilitado if (ShowAllPoints) { DrawZigZag(); } // Solo buscar patrones si tenemos suficientes puntos if (peakPoints.Count >= MinPointsForPattern/2&&valleyPoints.Count >= MinPointsForPattern/2) { // Detectar patrones Wolfe Wave FindWolfeWavePatterns(); } } #region ZigZag Detection private void FindZigZagPoints() { // Primero, verificar si hay un nuevo pico if (IsPeak(FractalStrength)) { // Verificar si este pico ya fue agregado bool alreadyExists = false; foreach (var point in peakPoints) { if (point.BarIndex == CurrentBar - FractalStrength) { alreadyExists = true; break; } } if (!alreadyExists) { WolfePoint newPeak = new WolfePoint( CurrentBar - FractalStrength, High[FractalStrength], Time[FractalStrength], true ); peakPoints.Add(newPeak); if (isDebugMode) { Print("WolfeWaveVisual: Nuevo pico detectado en barra " + newPeak.BarIndex + " a precio " + newPeak.Price); } // Marca el pico visualmente string tagName = "Peak_" + newPeak.BarIndex; Draw.Diamond(this, tagName, false, FractalStrength, High[FractalStrength], Brushes.Gold); Draw.Text(this, "txt_" + tagName, false, "P", FractalStrength, High[FractalStrength] + 3*TickSize, 0, Brushes.White, new SimpleFont("Arial", 9), TextAlignment.Center, Brushes.DarkGoldenrod, Brushes.DarkGoldenrod, 80); } } // Luego, verificar si hay un nuevo valle if (IsValley(FractalStrength)) { // Verificar si este valle ya fue agregado bool alreadyExists = false; foreach (var point in valleyPoints) { if (point.BarIndex == CurrentBar - FractalStrength) { alreadyExists = true; break; } } if (!alreadyExists) { WolfePoint newValley = new WolfePoint( CurrentBar - FractalStrength, Low[FractalStrength], Time[FractalStrength], false ); valleyPoints.Add(newValley); if (isDebugMode) { Print("WolfeWaveVisual: Nuevo valle detectado en barra " + newValley.BarIndex + " a precio " + newValley.Price); } // Marca el valle visualmente string tagName = "Valley_" + newValley.BarIndex; Draw.Diamond(this, tagName, false, FractalStrength, Low[FractalStrength], Brushes.DarkOrange); Draw.Text(this, "txt_" + tagName, false, "V", FractalStrength, Low[FractalStrength] - 3*TickSize, 0, Brushes.White, new SimpleFont("Arial", 9), TextAlignment.Center, Brushes.DarkOrange, Brushes.DarkOrange, 80); } } // Limpia puntos antiguos fuera del lookback CleanupOldPoints(); } private bool IsPeak(int strength) { if (CurrentBar < strength * 2) return false; double middleHigh = High[strength]; // Verificar las barras a la izquierda (barras más antiguas) for (int i = 1; i <= strength; i++) { if (High[strength + i] >= middleHigh) return false; } // Verificar las barras a la derecha (barras más recientes) for (int i = 1; i <= strength; i++) { if (High[strength - i] >= middleHigh) return false; } return true; } private bool IsValley(int strength) { if (CurrentBar < strength * 2) return false; double middleLow = Low[strength]; // Verificar las barras a la izquierda (barras más antiguas) for (int i = 1; i <= strength; i++) { if (Low[strength + i] <= middleLow) return false; } // Verificar las barras a la derecha (barras más recientes) for (int i = 1; i <= strength; i++) { if (Low[strength - i] <= middleLow) return false; } return true; } private void CleanupOldPoints() { // Mantener solo los puntos dentro del lookback int lookbackBar = Math.Max(0, CurrentBar - MaxLookback); // Limpiar picos antiguos peakPoints.RemoveAll(p => p.BarIndex < lookbackBar); // Limpiar valles antiguos valleyPoints.RemoveAll(v => v.BarIndex < lookbackBar); } private void DrawZigZag() { // Combinar todos los puntos List<WolfePoint> allPoints = new List<WolfePoint>(); allPoints.AddRange(peakPoints); allPoints.AddRange(valleyPoints); // Ordenar por índice de barra (del más antiguo al más reciente) allPoints = allPoints.OrderBy(p => p.BarIndex).ToList(); // Dibujar líneas ZigZag entre puntos consecutivos for (int i = 0; i < allPoints.Count - 1; i++) { WolfePoint current = allPoints[i]; WolfePoint next = allPoints[i + 1]; // Solo conectar si son de tipos diferentes (pico a valle o valle a pico) if (current.IsPeak != next.IsPeak) { string tagName = "ZigZag_" + current.BarIndex + "_" + next.BarIndex; Draw.Line(this, tagName, false, CurrentBar - current.BarIndex, current.Price, CurrentBar - next.BarIndex, next.Price, ZigZagColor, DashStyleHelper.Solid, 1); } } } #endregion #region Wolfe Wave Pattern Detection private void FindWolfeWavePatterns() { FindBullishWolfeWaves(); FindBearishWolfeWaves(); } private void FindBullishWolfeWaves() { // Verificar si tenemos suficientes valles (necesitamos al menos 3) y picos (necesitamos al menos 2) if (valleyPoints.Count < 3 || peakPoints.Count < 2) return; // Ordenar puntos de más recientes a más antiguos List<WolfePoint> sortedValleys = valleyPoints.OrderByDescending(v => v.BarIndex).ToList(); List<WolfePoint> sortedPeaks = peakPoints.OrderByDescending(p => p.BarIndex).ToList(); // Si no tenemos al menos un valle reciente para el punto 5, no hay patrón if (sortedValleys.Count == 0) return; // Comenzar con el valle más reciente como punto 5 WolfePoint point5 = sortedValleys[0]; // Buscar un pico antes del punto 5 para ser el punto 4 WolfePoint point4 = null; foreach (var peak in sortedPeaks) { if (peak.BarIndex < point5.BarIndex&&peak.Price > point5.Price) { point4 = peak; break; } } if (point4 == null) return; // Buscar un valle antes del punto 4 para ser el punto 3 WolfePoint point3 = null; foreach (var valley in sortedValleys) { if (valley.BarIndex < point4.BarIndex&&valley.Price < point4.Price) { point3 = valley; break; } } if (point3 == null) return; // Buscar un pico antes del punto 3 para ser el punto 2 WolfePoint point2 = null; foreach (var peak in sortedPeaks) { if (peak.BarIndex < point3.BarIndex&&peak.Price > point3.Price) { point2 = peak; break; } } if (point2 == null) return; // Buscar un valle antes del punto 2 para ser el punto 1 WolfePoint point1 = null; foreach (var valley in sortedValleys) { if (valley.BarIndex < point2.BarIndex&&valley.Price < point2.Price) { point1 = valley; break; } } if (point1 == null) return; // Verificar si es un patrón Wolfe Wave Bullish válido if (IsBullishWolfeWaveValid(point1, point2, point3, point4, point5)) { // Calcular el objetivo de precio double targetPrice = CalculateBullishTarget(point1, point3, point5); // Dibujar el patrón DrawBullishWolfeWave(point1, point2, point3, point4, point5, targetPrice); if (isDebugMode) { Print("WolfeWaveVisual: Patrón ALCISTA encontrado en barra " + CurrentBar); } } } private void FindBearishWolfeWaves() { // Verificar si tenemos suficientes picos (necesitamos al menos 3) y valles (necesitamos al menos 2) if (peakPoints.Count < 3 || valleyPoints.Count < 2) return; // Ordenar puntos de más recientes a más antiguos List<WolfePoint> sortedPeaks = peakPoints.OrderByDescending(p => p.BarIndex).ToList(); List<WolfePoint> sortedValleys = valleyPoints.OrderByDescending(v => v.BarIndex).ToList(); // Si no tenemos al menos un pico reciente para el punto 5, no hay patrón if (sortedPeaks.Count == 0) return; // Comenzar con el pico más reciente como punto 5 WolfePoint point5 = sortedPeaks[0]; // Buscar un valle antes del punto 5 para ser el punto 4 WolfePoint point4 = null; foreach (var valley in sortedValleys) { if (valley.BarIndex < point5.BarIndex&&valley.Price < point5.Price) { point4 = valley; break; } } if (point4 == null) return; // Buscar un pico antes del punto 4 para ser el punto 3 WolfePoint point3 = null; foreach (var peak in sortedPeaks) { if (peak.BarIndex < point4.BarIndex&&peak.Price > point4.Price) { point3 = peak; break; } } if (point3 == null) return; // Buscar un valle antes del punto 3 para ser el punto 2 WolfePoint point2 = null; foreach (var valley in sortedValleys) { if (valley.BarIndex < point3.BarIndex&&valley.Price < point3.Price) { point2 = valley; break; } } if (point2 == null) return; // Buscar un pico antes del punto 2 para ser el punto 1 WolfePoint point1 = null; foreach (var peak in sortedPeaks) { if (peak.BarIndex < point2.BarIndex&&peak.Price > point2.Price) { point1 = peak; break; } } if (point1 == null) return; // Verificar si es un patrón Wolfe Wave Bearish válido if (IsBearishWolfeWaveValid(point1, point2, point3, point4, point5)) { // Calcular el objetivo de precio double targetPrice = CalculateBearishTarget(point1, point3, point5); // Dibujar el patrón DrawBearishWolfeWave(point1, point2, point3, point4, point5, targetPrice); if (isDebugMode) { Print("WolfeWaveVisual: Patrón BAJISTA encontrado en barra " + CurrentBar); } } } private bool IsBullishWolfeWaveValid(WolfePoint p1, WolfePoint p2, WolfePoint p3, WolfePoint p4, WolfePoint p5) { // Verificar la secuencia de tiempo if (!(p1.BarIndex < p2.BarIndex&&p2.BarIndex < p3.BarIndex&&p3.BarIndex < p4.BarIndex&&p4.BarIndex < p5.BarIndex)) { return false; } // Verificar que los puntos alternan entre picos y valles if (!(p1.IsPeak == false&&p2.IsPeak == true&&p3.IsPeak == false&&p4.IsPeak == true&&p5.IsPeak == false)) { return false; } // Para patrones bullish, el punto 5 debe ser más bajo que el punto 3 if (p5.Price >= p3.Price) { if (isDebugMode) Print("WolfeWaveVisual: Patrón BULLISH rechazado - Punto 5 no es más bajo que Punto 3"); return false; } // El punto 4 debe ser más alto que el punto 2 if (p4.Price <= p2.Price) { if (isDebugMode) Print("WolfeWaveVisual: Patrón BULLISH rechazado - Punto 4 no es más alto que Punto 2"); return false; } // Calcular pendientes double slope13 = CalculateSlope(p1, p3); double slope24 = CalculateSlope(p2, p4); double slope14 = CalculateSlope(p1, p4); // En un patrón bullish, la pendiente 1-3 debe ser menos positiva (o más negativa) que la pendiente 2-4 // Permitimos cierta tolerancia double tolerance = Math.Abs(slope24 * PatternTolerance); if (slope13 >= slope24 + tolerance) { if (isDebugMode) Print("WolfeWaveVisual: Patrón BULLISH rechazado - Pendiente 1-3 no converge con 2-4"); return false; } return true; } private bool IsBearishWolfeWaveValid(WolfePoint p1, WolfePoint p2, WolfePoint p3, WolfePoint p4, WolfePoint p5) { // Verificar la secuencia de tiempo if (!(p1.BarIndex < p2.BarIndex&&p2.BarIndex < p3.BarIndex&&p3.BarIndex < p4.BarIndex&&p4.BarIndex < p5.BarIndex)) { return false; } // Verificar que los puntos alternan entre picos y valles if (!(p1.IsPeak == true&&p2.IsPeak == false&&p3.IsPeak == true&&p4.IsPeak == false&&p5.IsPeak == true)) { return false; } // Para patrones bearish, el punto 5 debe ser más alto que el punto 3 if (p5.Price <= p3.Price) { if (isDebugMode) Print("WolfeWaveVisual: Patrón BEARISH rechazado - Punto 5 no es más alto que Punto 3"); return false; } // El punto 4 debe ser más bajo que el punto 2 if (p4.Price >= p2.Price) { if (isDebugMode) Print("WolfeWaveVisual: Patrón BEARISH rechazado - Punto 4 no es más bajo que Punto 2"); return false; } // Calcular pendientes double slope13 = CalculateSlope(p1, p3); double slope24 = CalculateSlope(p2, p4); double slope14 = CalculateSlope(p1, p4); // En un patrón bearish, la pendiente 1-3 debe ser más positiva (o menos negativa) que la pendiente 2-4 // Permitimos cierta tolerancia double tolerance = Math.Abs(slope24 * PatternTolerance); if (slope13 <= slope24 - tolerance) { if (isDebugMode) Print("WolfeWaveVisual: Patrón BEARISH rechazado - Pendiente 1-3 no converge con 2-4"); return false; } return true; } private double CalculateSlope(WolfePoint start, WolfePoint end) { if (end.BarIndex == start.BarIndex) return 0; return (end.Price - start.Price) / (end.BarIndex - start.BarIndex); } #endregion #region Visualization Methods private void DrawBullishWolfeWave(WolfePoint p1, WolfePoint p2, WolfePoint p3, WolfePoint p4, WolfePoint p5, double targetPrice) { patternCount++; string patternId = "Bull_" + CurrentBar + "_" + patternCount; // Calcular las coordenadas de barra para el dibujo (distancia desde la barra actual) int x1 = CurrentBar - p1.BarIndex; int x2 = CurrentBar - p2.BarIndex; int x3 = CurrentBar - p3.BarIndex; int x4 = CurrentBar - p4.BarIndex; int x5 = CurrentBar - p5.BarIndex; // Dibujar líneas conectando los puntos Draw.Line(this, patternId + "_1_2", false, x1, p1.Price, x2, p2.Price, BullishColor, DashStyleHelper.Solid, 2); Draw.Line(this, patternId + "_2_3", false, x2, p2.Price, x3, p3.Price, BullishColor, DashStyleHelper.Solid, 2); Draw.Line(this, patternId + "_3_4", false, x3, p3.Price, x4, p4.Price, BullishColor, DashStyleHelper.Solid, 2); Draw.Line(this, patternId + "_4_5", false, x4, p4.Price, x5, p5.Price, BullishColor, DashStyleHelper.Solid, 2); // Dibujar líneas de proyección si está habilitado if (ShowTargetProjection) { // Extender la línea 1-3 para proyectar el objetivo de precio // Calculamos la barra donde la proyección alcanzaría el objetivo double slope13 = CalculateSlope(p1, p3); int barsFromPoint1 = p5.BarIndex - p1.BarIndex; int projectionBars = barsFromPoint1 + Math.Min(50, barsFromPoint1 / 2); // Dibujar proyección desde punto 1 hasta el objetivo Draw.Line(this, patternId + "_target", false, x1, p1.Price, CurrentBar - (p1.BarIndex + projectionBars), targetPrice, Brushes.Gold, DashStyleHelper.Dash, 2); // Etiquetar el precio objetivo Draw.Text(this, patternId + "_targetlabel", false, "Target: " + FormatPrice(targetPrice), CurrentBar - (p1.BarIndex + projectionBars/2), targetPrice, 0, Brushes.White, new SimpleFont("Arial", 10), TextAlignment.Center, Brushes.DarkGoldenrod, Brushes.DarkGoldenrod, 80); } // Etiquetar los puntos Draw.Text(this, patternId + "_p1", false, "1", x1, p1.Price, 0, Brushes.White, new SimpleFont("Arial", 10), TextAlignment.Center, Brushes.DarkGreen, Brushes.DarkGreen, 80); Draw.Text(this, patternId + "_p2", false, "2", x2, p2.Price, 0, Brushes.White, new SimpleFont("Arial", 10), TextAlignment.Center, Brushes.DarkGreen, Brushes.DarkGreen, 80); Draw.Text(this, patternId + "_p3", false, "3", x3, p3.Price, 0, Brushes.White, new SimpleFont("Arial", 10), TextAlignment.Center, Brushes.DarkGreen, Brushes.DarkGreen, 80); Draw.Text(this, patternId + "_p4", false, "4", x4, p4.Price, 0, Brushes.White, new SimpleFont("Arial", 10), TextAlignment.Center, Brushes.DarkGreen, Brushes.DarkGreen, 80); Draw.Text(this, patternId + "_p5", false, "5", x5, p5.Price, 0, Brushes.White, new SimpleFont("Arial", 10), TextAlignment.Center, Brushes.DarkGreen, Brushes.DarkGreen, 80); // Dibujar un triángulo para marcar el patrón completo Draw.TriangleUp(this, patternId + "_marker", false, x5, p5.Price - 2 * TickSize, BullishColor); Alert("WolfeWave_Bull", Priority.Medium, "Wolfe Wave Bullish Pattern", NinjaTrader.Core.Globals.InstallDir + @"\sounds\Alert1.wav", 0, Brushes.LimeGreen, Brushes.Black); } private void DrawBearishWolfeWave(WolfePoint p1, WolfePoint p2, WolfePoint p3, WolfePoint p4, WolfePoint p5, double targetPrice) { patternCount++; string patternId = "Bear_" + CurrentBar + "_" + patternCount; // Calcular las coordenadas de barra para el dibujo (distancia desde la barra actual) int x1 = CurrentBar - p1.BarIndex; int x2 = CurrentBar - p2.BarIndex; int x3 = CurrentBar - p3.BarIndex; int x4 = CurrentBar - p4.BarIndex; int x5 = CurrentBar - p5.BarIndex; // Dibujar líneas conectando los puntos Draw.Line(this, patternId + "_1_2", false, x1, p1.Price, x2, p2.Price, BearishColor, DashStyleHelper.Solid, 2); Draw.Line(this, patternId + "_2_3", false, x2, p2.Price, x3, p3.Price, BearishColor, DashStyleHelper.Solid, 2); Draw.Line(this, patternId + "_3_4", false, x3, p3.Price, x4, p4.Price, BearishColor, DashStyleHelper.Solid, 2); Draw.Line(this, patternId + "_4_5", false, x4, p4.Price, x5, p5.Price, BearishColor, DashStyleHelper.Solid, 2); // Dibujar líneas de proyección si está habilitado if (ShowTargetProjection) { // Extender la línea 1-3 para proyectar el objetivo de precio // Calculamos la barra donde la proyección alcanzaría el objetivo double slope13 = CalculateSlope(p1, p3); int barsFromPoint1 = p5.BarIndex - p1.BarIndex; int projectionBars = barsFromPoint1 + Math.Min(50, barsFromPoint1 / 2); // Dibujar proyección desde punto 1 hasta el objetivo Draw.Line(this, patternId + "_target", false, x1, p1.Price, CurrentBar - (p1.BarIndex + projectionBars), targetPrice, Brushes.Gold, DashStyleHelper.Dash, 2); // Etiquetar el precio objetivo Draw.Text(this, patternId + "_targetlabel", false, "Target: " + FormatPrice(targetPrice), CurrentBar - (p1.BarIndex + projectionBars/2), targetPrice, 0, Brushes.White, new SimpleFont("Arial", 10), TextAlignment.Center, Brushes.DarkGoldenrod, Brushes.DarkGoldenrod, 80); } // Etiquetar los puntos Draw.Text(this, patternId + "_p1", false, "1", x1, p1.Price, 0, Brushes.White, new SimpleFont("Arial", 10), TextAlignment.Center, Brushes.DarkRed, Brushes.DarkRed, 80); Draw.Text(this, patternId + "_p2", false, "2", x2, p2.Price, 0, Brushes.White, new SimpleFont("Arial", 10), TextAlignment.Center, Brushes.DarkRed, Brushes.DarkRed, 80); Draw.Text(this, patternId + "_p3", false, "3", x3, p3.Price, 0, Brushes.White, new SimpleFont("Arial", 10), TextAlignment.Center, Brushes.DarkRed, Brushes.DarkRed, 80); Draw.Text(this, patternId + "_p4", false, "4", x4, p4.Price, 0, Brushes.White, new SimpleFont("Arial", 10), TextAlignment.Center, Brushes.DarkRed, Brushes.DarkRed, 80); Draw.Text(this, patternId + "_p5", false, "5", x5, p5.Price, 0, Brushes.White, new SimpleFont("Arial", 10), TextAlignment.Center, Brushes.DarkRed, Brushes.DarkRed, 80); // Dibujar un triángulo para marcar el patrón completo Draw.TriangleDown(this, patternId + "_marker", false, x5, p5.Price + 2 * TickSize, BearishColor); Alert("WolfeWave_Bear", Priority.Medium, "Wolfe Wave Bearish Pattern", NinjaTrader.Core.Globals.InstallDir + @"\sounds\Alert2.wav", 0, Brushes.Crimson, Brushes.Black); } private double CalculateBullishTarget(WolfePoint p1, WolfePoint p3, WolfePoint p5) { double slope = CalculateSlope(p1, p3); int barDiff = p5.BarIndex - p1.BarIndex; double targetPrice = p1.Price + slope * barDiff; // Asegurar que el objetivo sea razonable (si es demasiado bajo, ajustarlo) return Math.Max(targetPrice, p5.Price + 5 * TickSize); } private double CalculateBearishTarget(WolfePoint p1, WolfePoint p3, WolfePoint p5) { double slope = CalculateSlope(p1, p3); int barDiff = p5.BarIndex - p1.BarIndex; double targetPrice = p1.Price + slope * barDiff; // Asegurar que el objetivo sea razonable (si es demasiado alto, ajustarlo) return Math.Min(targetPrice, p5.Price - 5 * TickSize); } private string FormatPrice(double price) { return Instrument.MasterInstrument.FormatPrice(price); } #endregion } }
-
Both files were uploaded by Apmoo here in the forum. The DTS comes from something else, I actually forget which files but the QuantumTrading has the same thing. The other comes from RightLineTrading.
-
 ⭐ puwing reacted to a post in a topic:
Favorite Indies
⭐ puwing reacted to a post in a topic:
Favorite Indies
-
Where can I find files for those? Dynamic DTS Map and modified Laguerre
-
Hello, Just wanted to share my thoughts on 2 of my most favorite indicators, which I have been using. One is the Dynamic DTS Map and the other is, Modified Laguerre (from RightLineTrading) Especially with the DTS Map, it reacts very accurately to price movement. It will change from red (short) to dark red, indicating a change is coming for the bull then blue comes and vice versa. I can confidently say, with this alone, trading ES, you can certainly achieve your few points a day for extra income. Combined with the Modified Laguerre indicator, they go perfectly together. However, the ML will come a tad slower than the DTS Map. I would say, when the DTS changes/shows dark red, you can enter your trade at this point. Or of course, you can wait until it completely changes to either bright red or blue. But in my personal experience by watching it for quite sometimes, it is good to just enter as early as it starts giving you the dark red color. https://limewire.com/d/rzEpD#LDkOvhA0vU https://limewire.com/d/CAFJY#NvYtmHaGGP I know Beauty has one of favorites that comes from Mbox, but I think this easily beats that.
- Today
-
Traderbeauty reacted to a post in a topic:
strategies.steady-turtle.com
-
https://workupload.com/file/jUgvQpSsUWq Thanks
- 1 reply
-
- 1
-
-
⭐ apmoo reacted to a post in a topic:
strategies.steady-turtle.com
-
kimsam reacted to a post in a topic:
strategies.steady-turtle.com
-

Ultimate Scalper Pro & Ultimate Backdoor Needs Unlocking
Ninja_On_The_Roof replied to TickHunter's topic in Ninja Trader 8
Well we all know, trading ain't easy and stress free. That is for sure. I did, however, way back then when first starting out, bought his PDF course. Just some tweaking from the MACD. The owner, does seem like a genuine person. -

Ultimate Scalper Pro & Ultimate Backdoor Needs Unlocking
TickHunter replied to TickHunter's topic in Ninja Trader 8
I got it as a crack but was supposed to need my machine id, never tried installing it on another machine. Glad it worked. He has a ton of videos using it but he makes it look way easier to use than it actually is. -
deepseek and claude will get complet working code, chatgpt it completly dont understand complex code for ninjatrader all time failed , claude and deepseek it pure gold , also chinese qween 3.1 , use poe.com account will get free data each day for free 😍
-
Ultimate Scalper Pro & Ultimate Backdoor Needs Unlocking
Ninja_On_The_Roof replied to TickHunter's topic in Ninja Trader 8
I installed it. It just worked. Nothing to unlock. If we watch all the videos on YouTube, you gotta have a very strict ability to almost immediately move your stoploss to lock in gains. If you are one of those, greedy and have no disciplines, this will hurt you, especially in a fast moving market as NQ. Gotta accept the fact that because you immediately move your stoploss, you might just get stopped out left and right. -
alodante reacted to a post in a topic:
ERTS (Easy Renko Trading System) Needs Unlocking
-
ERTS (Easy Renko Trading System) Needs Unlocking
Ninja_On_The_Roof replied to TickHunter's topic in Ninja Trader 8
If you place 2 Super Trends on your charts, playing with setting from the ATR a bit. You would probably have a match, closely to this. When price cuts above or below one of them, it fires a signal. -
Alodante, The above settings look like they are for the Flash bot. As for NQ, if you notice, the stoploss is set at 200 ticks. That is a crazy amount of ticks for anyone to have a stomach to handle. I would crap in my pants. That said, if it is set at 200 ticks, it has to be a much longer play to hold, nothing "flash" about it, or in and out quickly.
-
ERTS (Easy Renko Trading System) Needs Unlocking
TickHunter replied to TickHunter's topic in Ninja Trader 8
It was part of ADTS but it has been removed from the site and YouTube for some reason. https://www.adts-trading-school.com -
Thank you Alodante🙏
-
I would say so yes. Short term wise, it is good so far but long term wise, who knows really. Definitely needs more testing on it. A few days won't do any good. https://limewire.com/d/uSBuf#DsRfqAWPr5 I used it on all 5 accounts of Take Profit Trader prop firm.
-
another bot to fix https://u.pcloud.link/publink/show?code=XZWt7b5ZXjkTfw8qUoYLQE9kv8LG8J9KGD8V Setup Instructions: • Open NinjaTrader. • Go to Tools > Import > Ninja Script Add-On. • Import the strategy file. To backtest, use the Strategy Analyzer with the current MNQ contract and a 1-minute timeframe. To run the strategy: • Open the "Strategies" tab at the bottom. • Right-click and select "New Strategy." • Choose PPNQ100 from the list, select the current MNQ contract, and set the 1-minute timeframe. • Choose the account you want to run the strategy on. • Click OK to save the settings and close the dialog. • Enable the checkbox next to the newly listed strategy.
- 1 reply
-
- 2
-
-
-
this is the setting for NQ and ES https://u.pcloud.link/publink/show?code=VZGq7b5ZQt1FgVW0BtufpFogoQyajpDUrEEX
-

ERTS (Easy Renko Trading System) Needs Unlocking
alodante replied to TickHunter's topic in Ninja Trader 8
hello what its the original website from ERTS? -
Danke für deine info, ich habe es mit ChaGPT, mit DeepSeek versucht und beim komplimieren tauchen fehler auf.
-
UUPPPPP... Good Question
-
if you have paid gemini or claude latest version he can build this without any error , claude is working, use mistral with deepseek thinking to solve error for free
-
⭐ nadjib reacted to a post in a topic:
WOLFE WAVE
-

HFMarkets (hfm.com): Market analysis services.
AllForexnews replied to AllForexnews's topic in Fundamental Analysis
[b]Date: 29th April 2025.[/b] [b]NASDAQ Climbs Higher as Markets Brace for Key Earnings and Jobs Data![/b] The NASDAQ rose to a 4-week high as investors get ready for a crucial week ahead. The NASDAQ has earned back 46% of the price lost during the stock market crash seen in March and April. However, what is needed for the correction to continue? This week can be the deciding factor. NASDAQ - Quarterly Earnings Report Over a period of 48 hours, the NASDAQ will see 5 significant companies release their earnings report for the first quarter of 2025. The NASDAQ’s exposure as an index is exactly 27% towards these companies making the 48-hour crucial for the index. These 5 companies include the following: Microsoft: Wednesday after market close - Up 7.61% over the past 5 days Meta: Wednesday after market close - 11.84% over the past 5 days Qualcomm: Wednesday after market close - 7.96% over the past 5 days Apple: Thursday after market close - 7.07% over the past 5 days Amazon: Thursday after market close - 10.45% over the past 5 days The price movement of the 5 stocks over the past week has been relatively positive, but this is also partially due to the improvements in investor sentiment. Therefore, it is not necessarily solely due to the upcoming earnings reports. Out of the 5 stocks, analysts expect only Microsoft and Meta to see higher earnings and revenue compared to the previous quarter. However, the key concern for investors is that the actual figures either exceed or at least match the projections. If the companies beat the expectations, investors are likely to witness the bullish momentum continue and potentially gain speed. However, if the companies fail to do so, the index can quickly correct itself, moving back down. Another factor which the market will be laser-focused on is the comments from the board of directors on current concerns such as a possible recession and the trade policy. If the comments provide a positive tone and a sense of hope, the risk appetite can improve and support stocks across the board. NASDAQ - Employment To Play A Key Role! As recession fears grow and economists raise the likelihood of a downturn to 30–50%, attention shifts to the employment sector. This week will be key for employment as the US will confirm the number of new job vacancies, the unemployment rate and new confirmed employment. On occasions, stronger employment data can pressure the stock market as it's likely to keep interest rates high. However, under the current circumstances, a positive release from all US news potential may support the NASDAQ. Analysts expect the Unemployment Rate and JOLTS Job Opening figures to be similar to the previous month. However, the NFP Employment Change may dip! In addition to the employment data and earnings reports, investors will also monitor and analyse the Advanced Quarterly GDP and Core PCE Price Index. Currently, analysts expect the Core PCE Price Index to fall from 2.8% to 2.6%. If the index indeed falls to this level, volatility may be limited with a slight bullish bias. However, if the figure falls below 2.6% the NASDAQ potentially can increase further. NASDAQ - Technical Analysis The NASDAQ is trading above the trendlines on a 2-hour timeframe and above the Volume-Weighted Average for the day. These two factors indicate a bullish bias and bullish signals are likely to strengthen if the price rises above $19,496.31 according to price action. However, if the price falls below $19,357.30, the NASDAQ’s outlook will quickly change. Traders should note that this week’s price movement will be dependent on the developments from earnings, trade policy and the employment sector. Key Takeaway Points: Microsoft, Meta, Qualcomm, Apple, and Amazon will report earnings within 48 hours, and with a combined 27% index weight, their results could significantly impact the market's direction. Recent stock gains suggest that investor sentiment is improving. However, sustained bullish momentum will depend on whether these companies meet or exceed earnings expectations and provide optimistic guidance. Investors will also closely watch US employment data, GDP figures, and the Core PCE Price Index. A drop in inflation below 2.6% could potentially provide additional support for the NASDAQ. Technically, the NASDAQ maintains a bullish outlook while trading above key trendlines, but a move below $19,357.30 could signal a shift toward a bearish trend. [b]Always trade with strict risk management. Your capital is the single most important aspect of your trading business.[/b] [b]Please note that times displayed based on local time zone and are from time of writing this report.[/b] Click [url=https://www.hfm.com/hf/en/trading-tools/economic-calendar.html][b]HERE[/b][/url] to access the full HFM Economic calendar. Want to learn to trade and analyse the markets? Join our webinars and get analysis and trading ideas combined with better understanding of how markets work. Click [url=https://www.hfm.com/en/trading-tools/trading-webinars.html][b]HERE[/b][/url] to register for FREE! [url=https://analysis.hfm.com/][b]Click HERE to READ more Market news.[/b][/url] [b]Michalis Efthymiou HFMarkets[/b] [b]Disclaimer:[/b] This material is provided as a general marketing communication for information purposes only and does not constitute an independent investment research. Nothing in this communication contains, or should be considered as containing, an investment advice or an investment recommendation or a solicitation for the purpose of buying or selling of any financial instrument. All information provided is gathered from reputable sources and any information containing an indication of past performance is not a guarantee or reliable indicator of future performance. Users acknowledge that any investment in Leveraged Products is characterized by a certain degree of uncertainty and that any investment of this nature involves a high level of risk for which the users are solely responsible and liable. We assume no liability for any loss arising from any investment made based on the information provided in this communication. This communication must not be reproduced or further distributed without our prior written permission. -

Ultimate Scalper Pro & Ultimate Backdoor Needs Unlocking
Mr_Wall replied to TickHunter's topic in Ninja Trader 8
Hello and thanks, but when I installed, NT8 gave me this error