⤴️-Paid Ad- Check advertising disclaimer here. Add your banner here.🔥
All Activity
- Past hour
-
PLEASE
-
 interflash1 reacted to a post in a topic:
Predator lastest
interflash1 reacted to a post in a topic:
Predator lastest
- Today
-
sorry , ifogrot to mention, its HA candles the strategy
-
it doesn't satisfy me

-
FCScalper reacted to a post in a topic:
Tholvi Trader
-
https://clubbingbuy.exchange/threads/tholvit-mbo-heatmap.4458/ To everyone interested
-
HA candles btw
-
attached is the settings. someone with TDview premium can test and let us know please. dont have premium tdview. 6nN5aaRypR
-
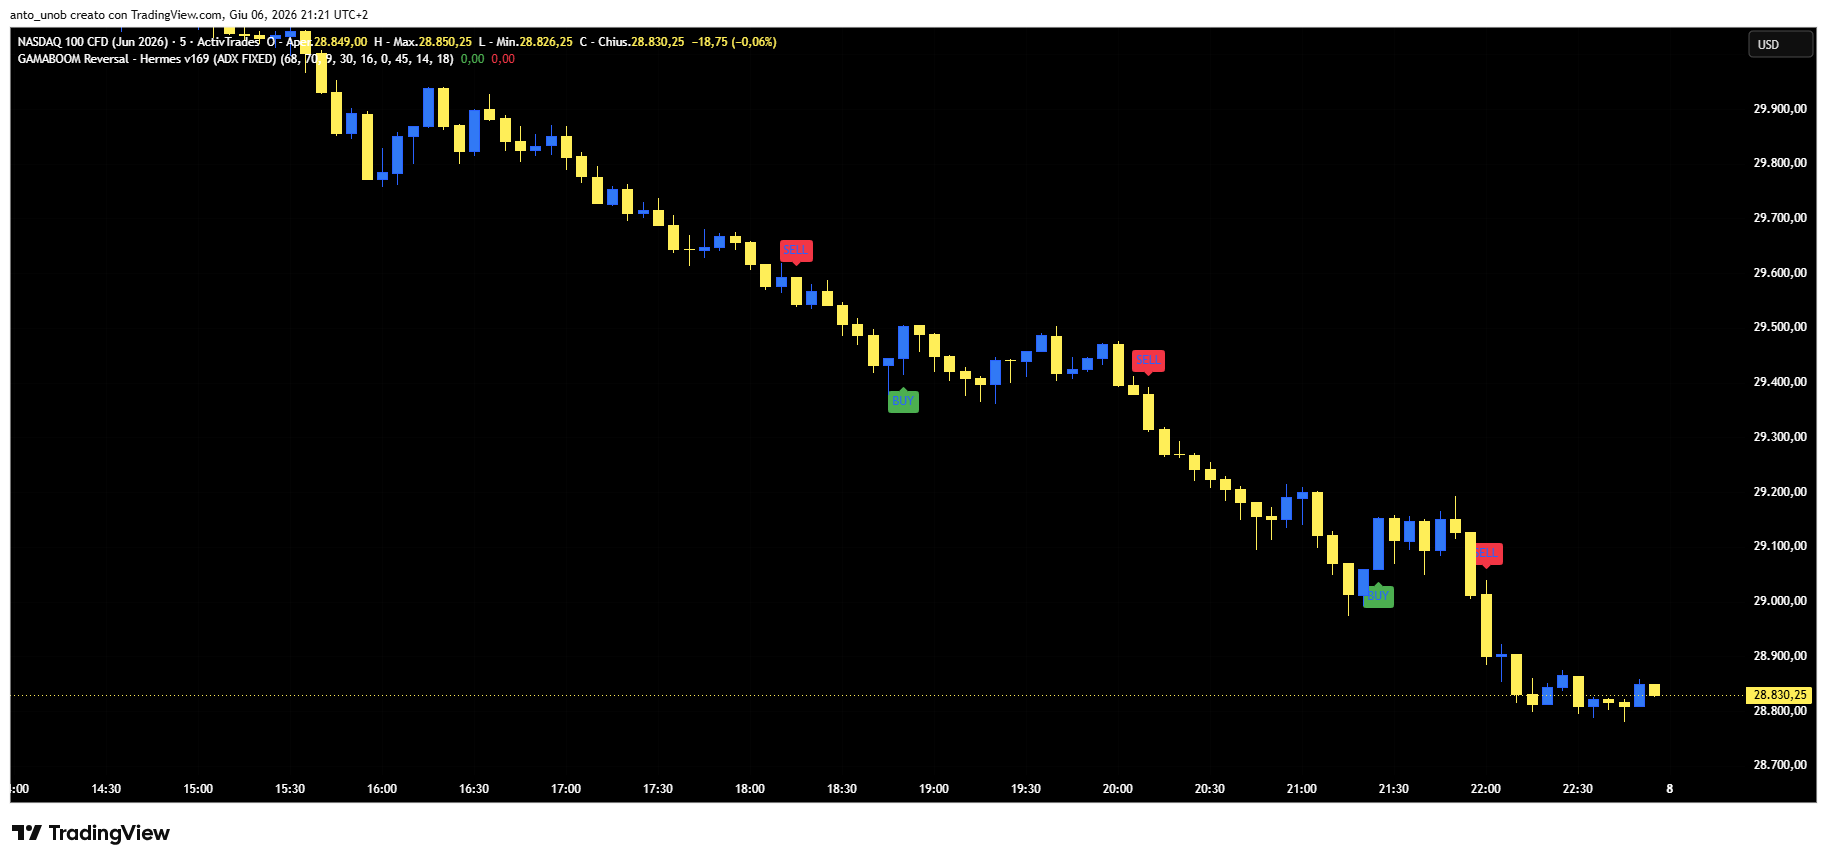
this is a strategy based on the close and every tick: //@version=6 strategy("GAMABOOM Reversal - Hermes v169 (ADX FIXED)", overlay=true, pyramiding=0, initial_capital=10000) //============================================================================= // TICK SETTINGS //============================================================================= stopTicks = input.int(20, "Stop Loss (Ticks)", minval=1) targetTicks = input.int(40, "Take Profit (Ticks)", minval=1) tickSize = syminfo.mintick sl = stopTicks * tickSize tp = targetTicks * tickSize //============================================================================= // TIME FILTER //============================================================================= useTimeFilter = input.bool(true, "Enable Session Filter") startHour = input.int(9, "Start Hour", minval=0, maxval=23) startMinute = input.int(30, "Start Minute", minval=0, maxval=59) endHour = input.int(16, "End Hour", minval=0, maxval=23) endMinute = input.int(0, "End Minute", minval=0, maxval=59) currentMinutes = hour * 60 + minute startMinutes = startHour * 60 + startMinute endMinutes = endHour * 60 + endMinute inSession = not useTimeFilter or (currentMinutes >= startMinutes and currentMinutes <= endMinutes) //============================================================================= // CORE SIGNALS //============================================================================= src = close pchange = ta.change(src, 1) / src * 100 avpchange = ta.alma(pchange, 28, 0.85, 7) rsi = ta.rsi(close, 10) rsiL = rsi > rsi[1] rsiS = rsi < rsi[1] // Chande Momentum length11 = 17 momm = ta.change(close) f1(m) => m >= 0.0 ? m : 0.0 f2(m) => m >= 0.0 ? 0.0 : -m sm1 = math.sum(f1(momm), length11) sm2 = math.sum(f2(momm), length11) percent(nom, div) => 100 * nom / div chandeMO = percent(sm1 - sm2, sm1 + sm2) cL = chandeMO > chandeMO[1] cS = chandeMO < chandeMO[1] // GMA length_gama = 19 sigma_gama = ta.stdev(close, 20) gma = 0.0 sumW = 0.0 for i = 0 to length_gama - 1 w = math.exp(-math.pow(((i - (length_gama - 1)) / (2 * sigma_gama)), 2) / 2) v = ta.highest(avpchange, i + 1) + ta.lowest(avpchange, i + 1) gma += v * w sumW += w gma := (gma / sumW) / 2 gma := ta.ema(gma, 7) //============================================================================= // FLOOR PRESSURE FILTER //============================================================================= threshold = input.int(45, "Floor Pressure Threshold") tr1 = high - low tr2 = math.abs(high - nz(close[1])) tr3 = math.abs(low - nz(close[1])) r7c = math.max(tr1, math.max(tr2, tr3)) p5y = high - nz(high[1]) > nz(low[1]) - low ? math.max(high - nz(high[1]), 0) : 0 d4h = nz(low[1]) - low > high - nz(high[1]) ? math.max(nz(low[1]) - low, 0) : 0 var float v5g = 0.0 v5g := nz(v5g[1]) - (nz(v5g[1]) / 1) + r7c var float p1b = 0.0 p1b := nz(p1b[1]) - (nz(p1b[1]) / 1) + p5y var float b6t = 0.0 b6t := nz(b6t[1]) - (nz(b6t[1]) / 1) + d4h bullPressure = v5g != 0 ? p1b / v5g * 100 : 0 bearPressure = v5g != 0 ? b6t / v5g * 100 : 0 bullFloor = math.floor(bullPressure) bearFloor = math.floor(bearPressure) bullFloorOK = bullFloor > bearFloor and bullFloor >= threshold bearFloorOK = bearFloor > bullFloor and bearFloor >= threshold //============================================================================= // ADX FILTER (FIXED USING DMI) //============================================================================= adxLen = input.int(14, "ADX Length") adxMin = input.float(18, "ADX Min Threshold") [dmiPlus, dmiMinus, adx] = ta.dmi(adxLen, adxLen) adxOk = adx > adxMin //============================================================================= // SIGNALS //============================================================================= asgma_buy = ta.crossover(avpchange, gma) and rsiL and cL asgma_sell = ta.crossunder(avpchange, gma) and rsiS and cS bom_buy = ta.crossover(avpchange, gma) bom_sell = ta.crossunder(avpchange, gma) bomVolSma = ta.sma(volume, 14) bomVolumeOk = volume > bomVolSma * 0.5 confirmed_buy = asgma_buy and bom_buy and bomVolumeOk and inSession confirmed_sell = asgma_sell and bom_sell and bomVolumeOk and inSession //============================================================================= // FINAL ENTRY FILTER (FLOOR + ADX) //============================================================================= longCondition = confirmed_buy and bullFloorOK and adxOk shortCondition = confirmed_sell and bearFloorOK and adxOk if longCondition strategy.entry("LONG", strategy.long) if shortCondition strategy.entry("SHORT", strategy.short) //============================================================================= // EXITS //============================================================================= strategy.exit("LONG EXIT", from_entry="LONG", stop=close - sl, limit=close + tp) strategy.exit("SHORT EXIT", from_entry="SHORT", stop=close + sl, limit=close - tp) //============================================================================= // VISUALS //============================================================================= plotshape(longCondition, title="LONG", style=shape.labelup, location=location.belowbar, color=color.green, text="BUY") plotshape(shortCondition, title="SHORT", style=shape.labeldown, location=location.abovebar, color=color.red, text="SELL")
-
will take a look.thank you somuch for the effort. maybe now we can do some ML stuff on it and refine seettings 🙂
-
Do you also have latest T@U files, sir? @Eva Grey Thank you anytime.
-
luludulu reacted to a post in a topic:
Been a while since I stopped by — here’s a new Ninz@ indicator
-
AI converted. Notes from AI: The performance table is static text. The "90.5% win rate / 15.89 profit factor" values are hardcoded display strings in the original Pine script — they aren't computed there and aren't computed here. I copied them verbatim so the visual matches, but they don't reflect any backtest. For real metrics, build this as a Strategy and run NinjaTrader's Strategy Analyzer. I'm not a financial advisor; treat those numbers as marketing labels, not validated results. barcolor(gmaColor) (recoloring the actual price candles) isn't something an overlay indicator can do cleanly in NT8 without a custom bar type, so I left it out and kept the trend signal on the colored ASGMA line instead. The background highlight (bgcolor) is reproduced faithfully. Volume Flow is a separate sub-panel in Pine. NT8 can't mix an overlay panel and a sub-panel in one indicator, so vfDif is computed and available but not plotted; if you want that oscillator, I can split it into a second non-overlay indicator. One behavioral note: the Volume Profile block in the original is buggy (its bucket array is a persistent var that never resets and vp_step uses only the current bar's range), so the POC rarely updates. I reproduced that behavior exactly rather than "fixing" it — say the word if you'd prefer a corrected rolling volume profile. GamaboomReversalHermes.cs
-
 trader88 reacted to a post in a topic:
Predator lastest
trader88 reacted to a post in a topic:
Predator lastest
-
You asked it politely and it worked or we need to ask you politely for a working version? 😂
-
Working good when asked politely: https://ibb.co/Sw5yCL3P
-
Have you shared your indicator?
-
I think i have found the bad ''noise''. the continuation logic is correct wich is the part that is providing the good signals. the bad ones 9 LIKE A BUY COMING AT THE TOP and vice versa0 IS BECAUSE the logic is not filtering continuation vs Exhaustion. so the logic for exhaustion seems to be great, this is firing Mean reversion signals to VP but instead its basing as continuation, breakout signals inducing bad bad trades. This probably gonna take a while now, but I guess its a starting point to fix. if anyone want to chime in, more than welcome to help.
-
I tried to convert it first but the logic in nt8 is different from TDview. Maye we can try with some with Ai premium account and see.. very open to the idea 🙂
-
Latest 3.9.0.2 non edu : https://workupload.com/file/CQyjwxqQBmc
-

Been a while since I stopped by — here’s a new Ninz@ indicator
trader88 replied to Eva Grey's topic in Ninja Trader 8
Which one doesnt work? -
 It does work, with the right Resource file. I did try and I had it worked. The only thing is, as always has been, you must be willing up some of your beloved other Ninza indies. To me, it isnt something that one die for. Dont need to waste your mind upon it.
 -
Yes thanks all for your time and explaining even on yt webinars 3 minute chart i cant really find an edge same as mtpredictor maybee for bigger timeframes 1 hour + ..
-
 misalto reacted to a post in a topic:
what about backtothefuturetrading aurora
misalto reacted to a post in a topic:
what about backtothefuturetrading aurora
-
misalto reacted to a post in a topic:
what about backtothefuturetrading aurora
-
Ninja448 reacted to a post in a topic:
Been a while since I stopped by — here’s a new Ninz@ indicator
-
3.9.0.1 is out. Going to look into it.
-
jquiroz75 reacted to a post in a topic:
Been a while since I stopped by — here’s a new Ninz@ indicator
-
⭐ timein reacted to a post in a topic:
Been a while since I stopped by — here’s a new Ninz@ indicator
- Yesterday
-
Warp was posted by someone here sometime ago. Not sure about Aurora. Aurora is just an extension to Warp where the manual interpretation of Warp is provided by Aurora. Although I did not end up using their software, from what I heard and saw, Backtothefuturetrading is very untrustworthy. I heard bad stuff since a decade ago about their flux capacitor indicators. But decided to try them out when clubbingbuy had them. Warp/Aurora was not useful although it does have its hits. Their turning points are so close to each other that definitely some will hit a peak or trough. And they have an additional around 10 price actions that you must take into consideration and make a discretion of how the price will really move. That is where Aurora comes into play. Aurora will do that interpretation. Overall, the turning points provide does not come as accurate and It was like that the price actions were the ones doing the decision making task. As I did not end up using the software, perhaps someone who had success with it can provide their POV. I was willing to give it a shot but dropped them like a hot potato when I got Force. It was previously advertised as the Law of Vibration, Master Time Factor, Gann etc. But now they have changed it to Vibrational Trading. It turned out to be nothing but a manual cycle adjuster. You adjust the cycle manually until the maximum peaks and troughs are taken out by a selected cycle. There is a dashboard that shows the % peaks / troughs touched by a selected cycle. I was shocked that they were selling Force for $10,000. A tool to manually find the dominant cycle. Techsignal (previously from Foundation for the Study of Cycles) does it similarly but it was done automatically and the best cycle was based on P&L not peaks and troughs. Similarly other software like Timing Solution, Wave59 (Lars Von Thienan) etc can identify the dominant cycle automatically. BTW I am not sure if the latest Force cycle finder is now automatic or not. The copy I used was couple of years old. Backtothefuturetrading have a weekly live webinar that you can join. You can attend them and you will probably know why Michael Lydick (cofounder) is such a convincing salesman.
-

Been a while since I stopped by — here’s a new Ninz@ indicator
JackSparrow440 replied to Eva Grey's topic in Ninja Trader 8
By default it shows gray bars. you need to change setting for regular color bars, Also it doesn't require Level 2 data feed. -

Been a while since I stopped by — here’s a new Ninz@ indicator
⭐ rcarlos1947 replied to Eva Grey's topic in Ninja Trader 8
When I imported, loaded without errors, is visible in the indicator list, loads on a chart without any errors in the "Log" tab, but all I get is gray bars. Am I correct on ASSuming that I need Level 2 data??? -
i got it from brokey instead of waiting for clubbing. his copy worked perfectly. on the surface the concept looks amazing ( same concept as Nexgen but conflunce of time instead of price). when you look at the predictions then it looks like wow its amazing etc but.... after watching it live for more than a week on the es only i figured that its a piece of sh... like everythign else lol. i would definitely not count on that for my trading. They do have free predictions on their website so you can take a look and see it live on your charts. Traderbeauty-Jane