⤴️-Paid Ad- Check advertising disclaimer here. Add your banner here.🔥


FCScalper
-
Posts
116 -
Joined
-
Last visited
-
Days Won
10
Content Type
Profiles
Forums
Articles
Everything posted by FCScalper
-
Go Eva go Eva! Thank you for the at
-
Following the Big trades, I created an average of the Big trades to filter out the most important ones, and those are not will turn into absorption. Pair this with de cumulative volume delta and volume profile and you will find Squeeezes like the one in the picture. For bullish, you want the line to move up, that means that big trade have big importance, and those who not, probably will be absorbed check out the picture attached, I caught that pump today after a cluster of big trades that did not add anything to it, later was going to be absorbed by buyers. Above zero, big bullish traders are more in control. below zero big sellers are in control. pair with the indicators above.
-
Got an indicator for Bigtrades, and decided to add a few modifications in order to make it better. Delta is added here and you can change the visuals. Works really well and been testing it since yesterday. Must say its better so far than most Bigtrades indicator I have seen. use it well and Pair with other Orderflow indicators hope it helps 🙂 T5kT2kaAJS
- 5 replies
-
- 14
-

-

-
Alternative to big trades. Screenshot 2026-02-22 140813.png Ninza volume delta, gomicators vol profile, Qmomentum, CYMO, *** Delta gomicators. Look at the exemple. hope it helps!
-
found it, sorry
-
I think this system can be powered with CYMo. can someone share the nt8 SMM so I can look uo on how to charge this stuff for more confluence please ? thank you
-
the Big trades are from Cluster Delta. i bought lifitime sub long time agom, its attached to my id and needs login to get the tools. Later one I will post an alternative to big trades that work with this system too, or you can get a sub with cluster delta for 7$ a month I believe.
-
Screenshot 2026-02-21 131325.png trying this combination too. KissOF + Ninza Daily Profile + Inside bar + Ninza Volume delta. Entering on the rejection on the upper range with delta increase, then paired with volume profile and profile by candle.
-
Another good day with this.

-
you have to paste the files in the custom folder.
-
XUAQzmsYy7
-
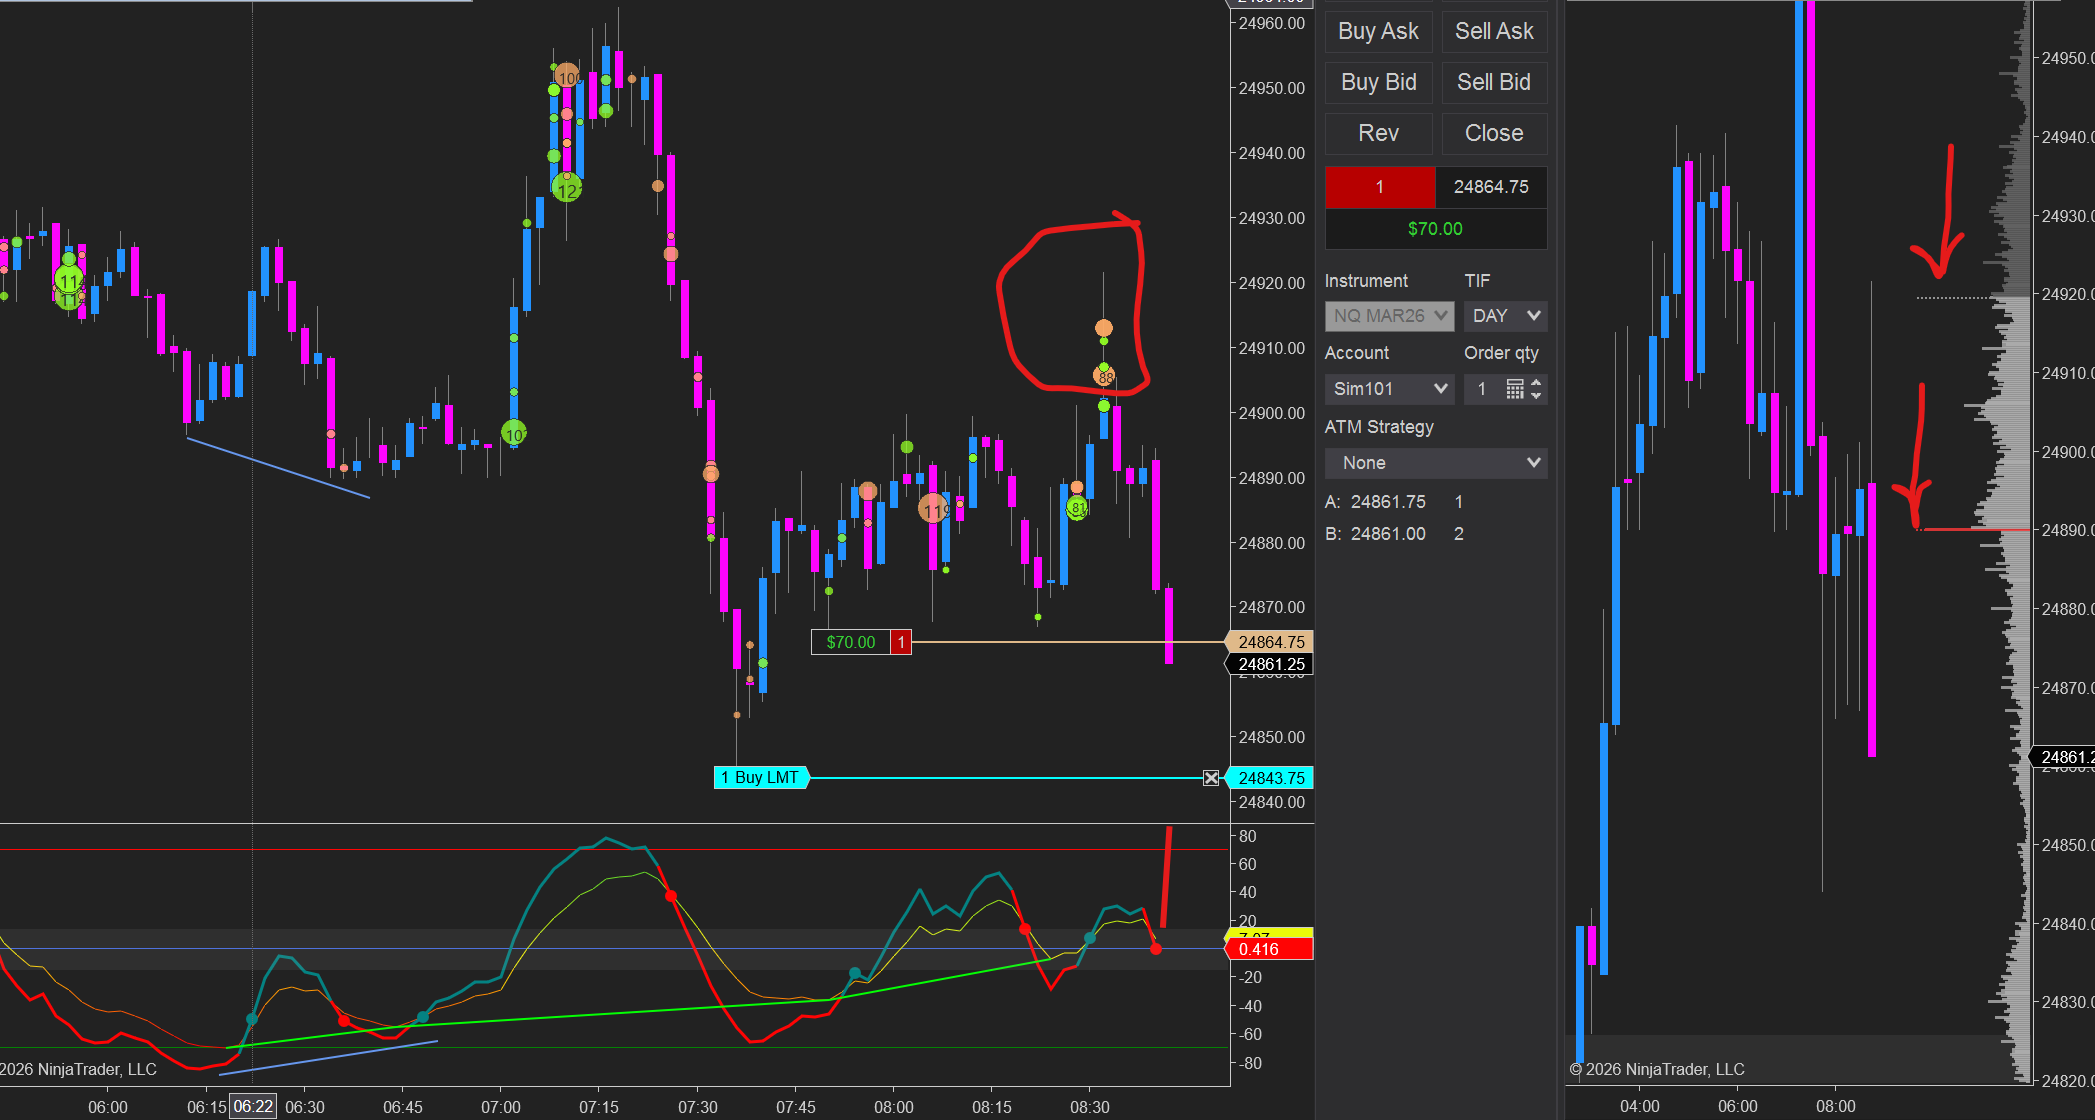
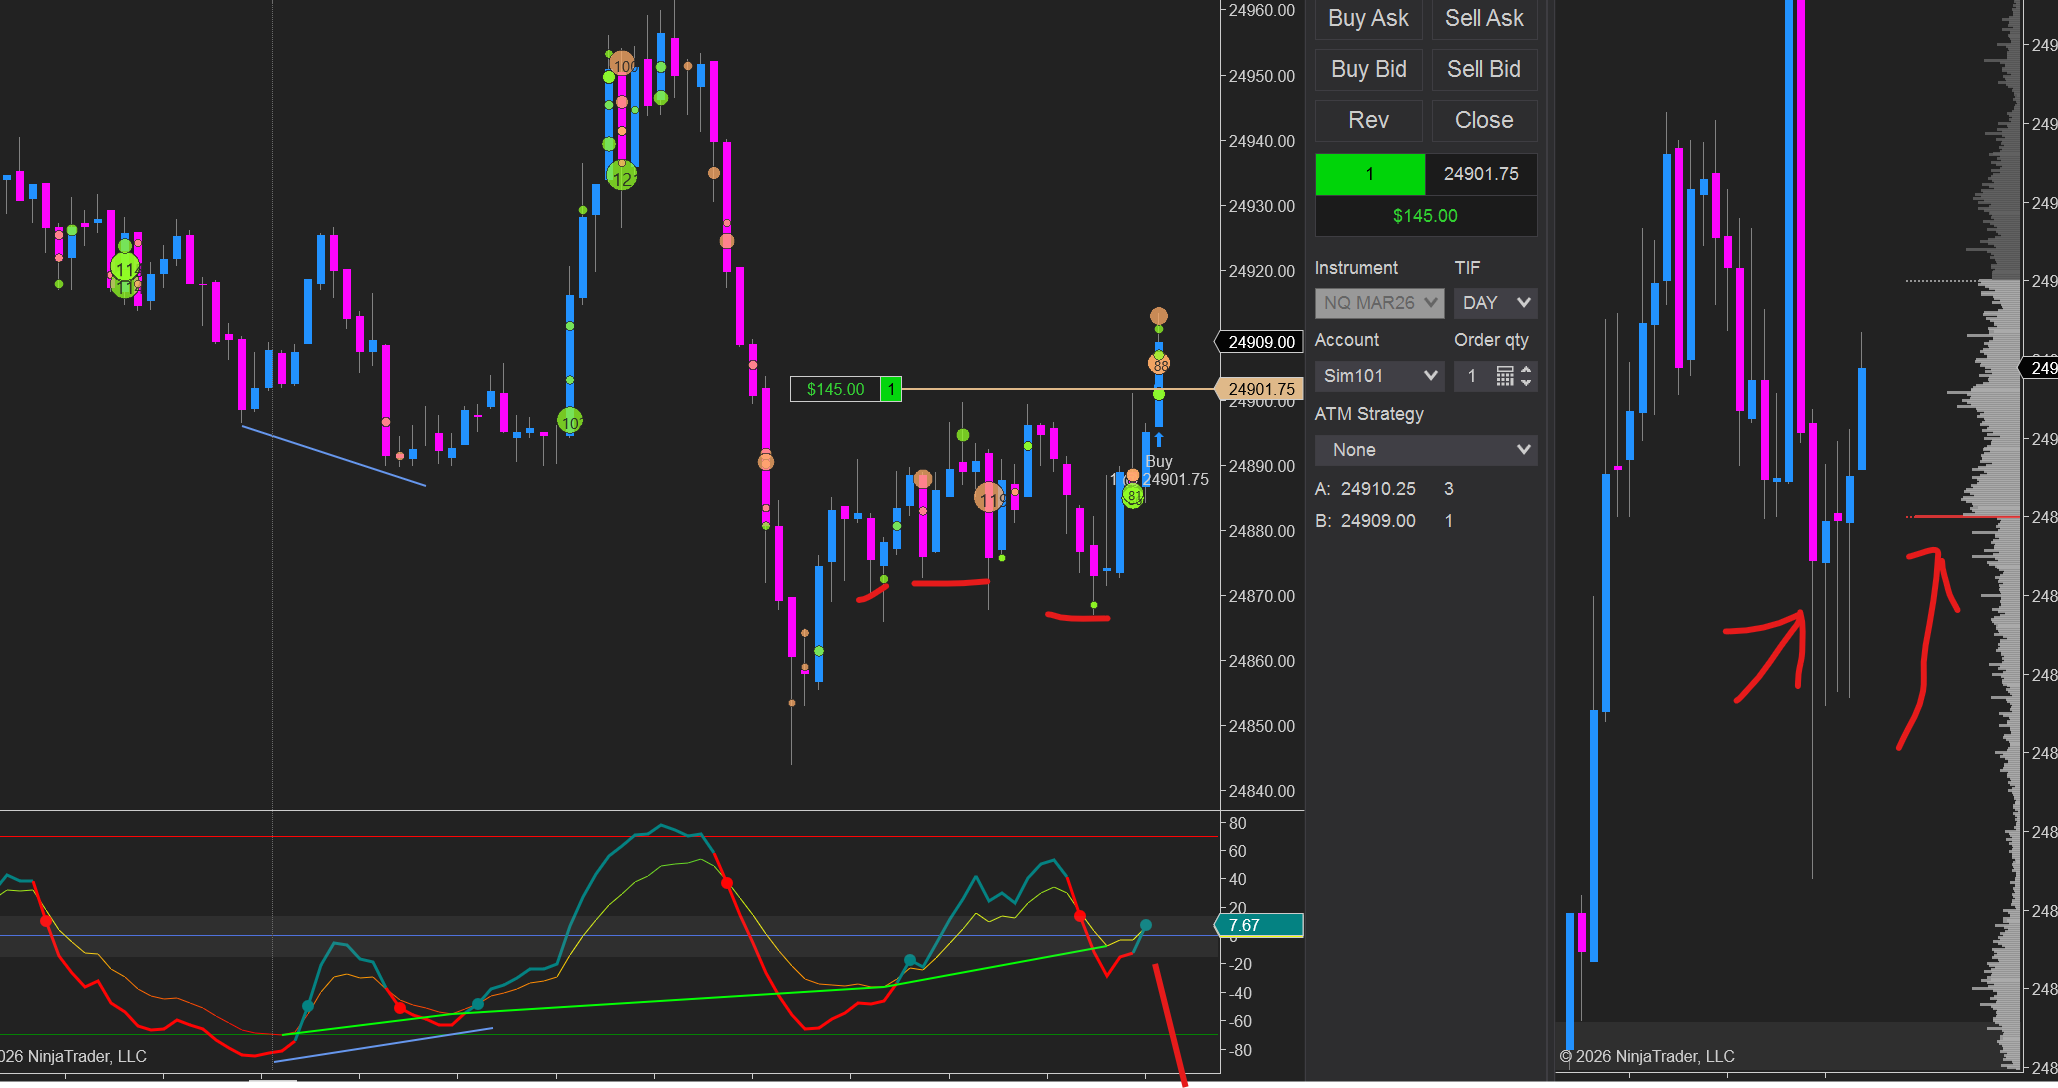
Following.... As you can see, if done properly even when a few wrong sided trades can go well too ( hahaha) this is my bread and butter). enjoy guys
-
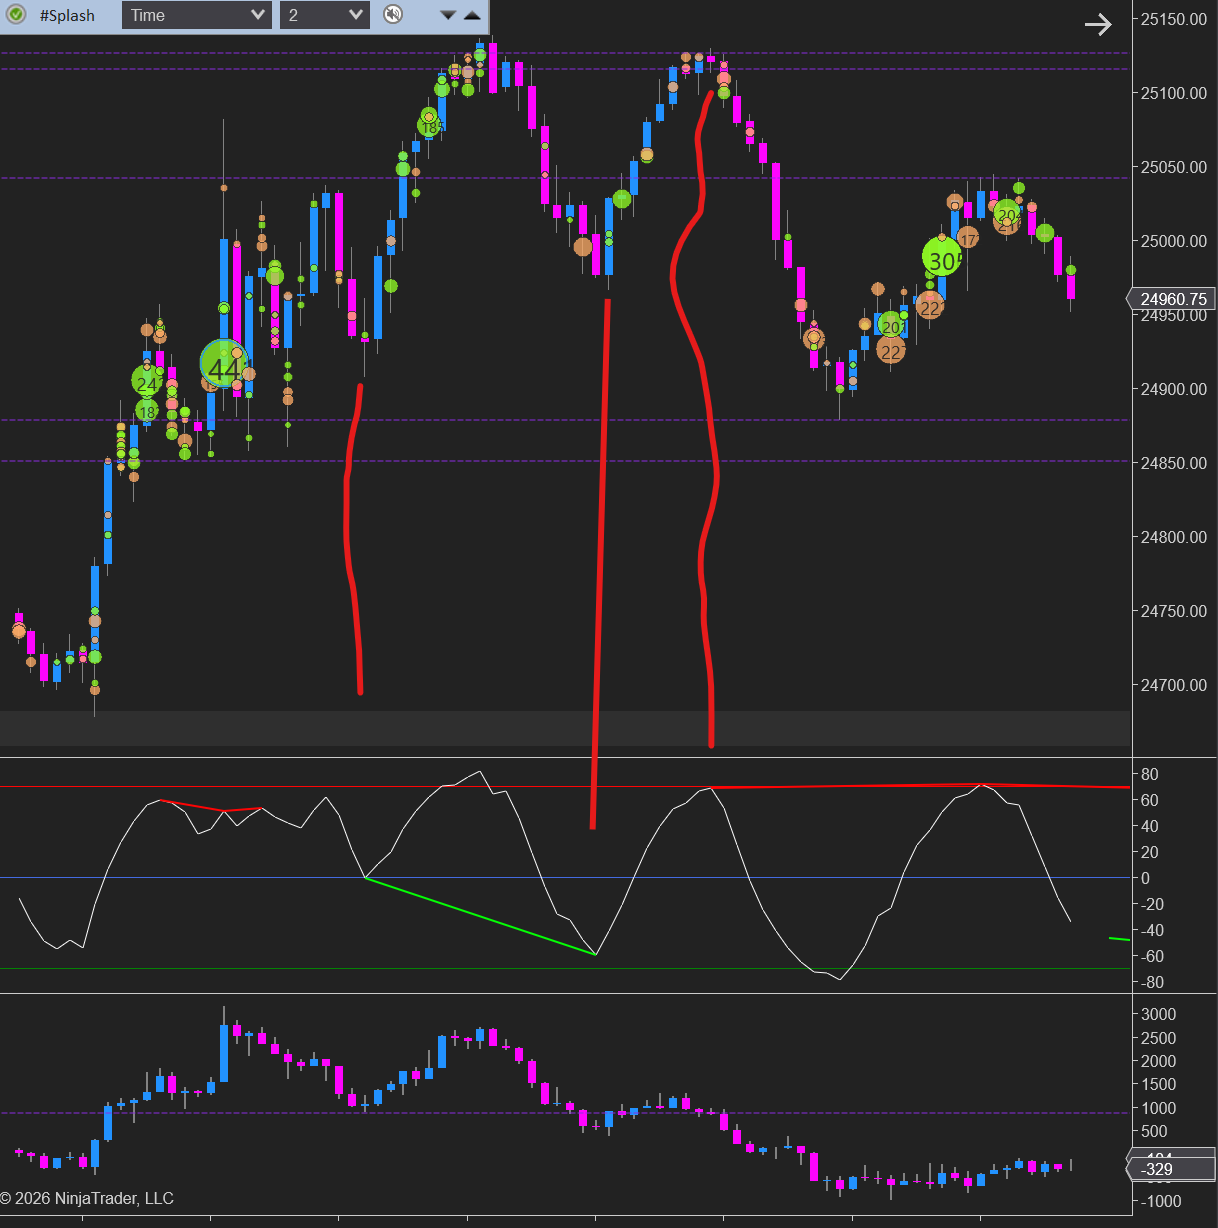
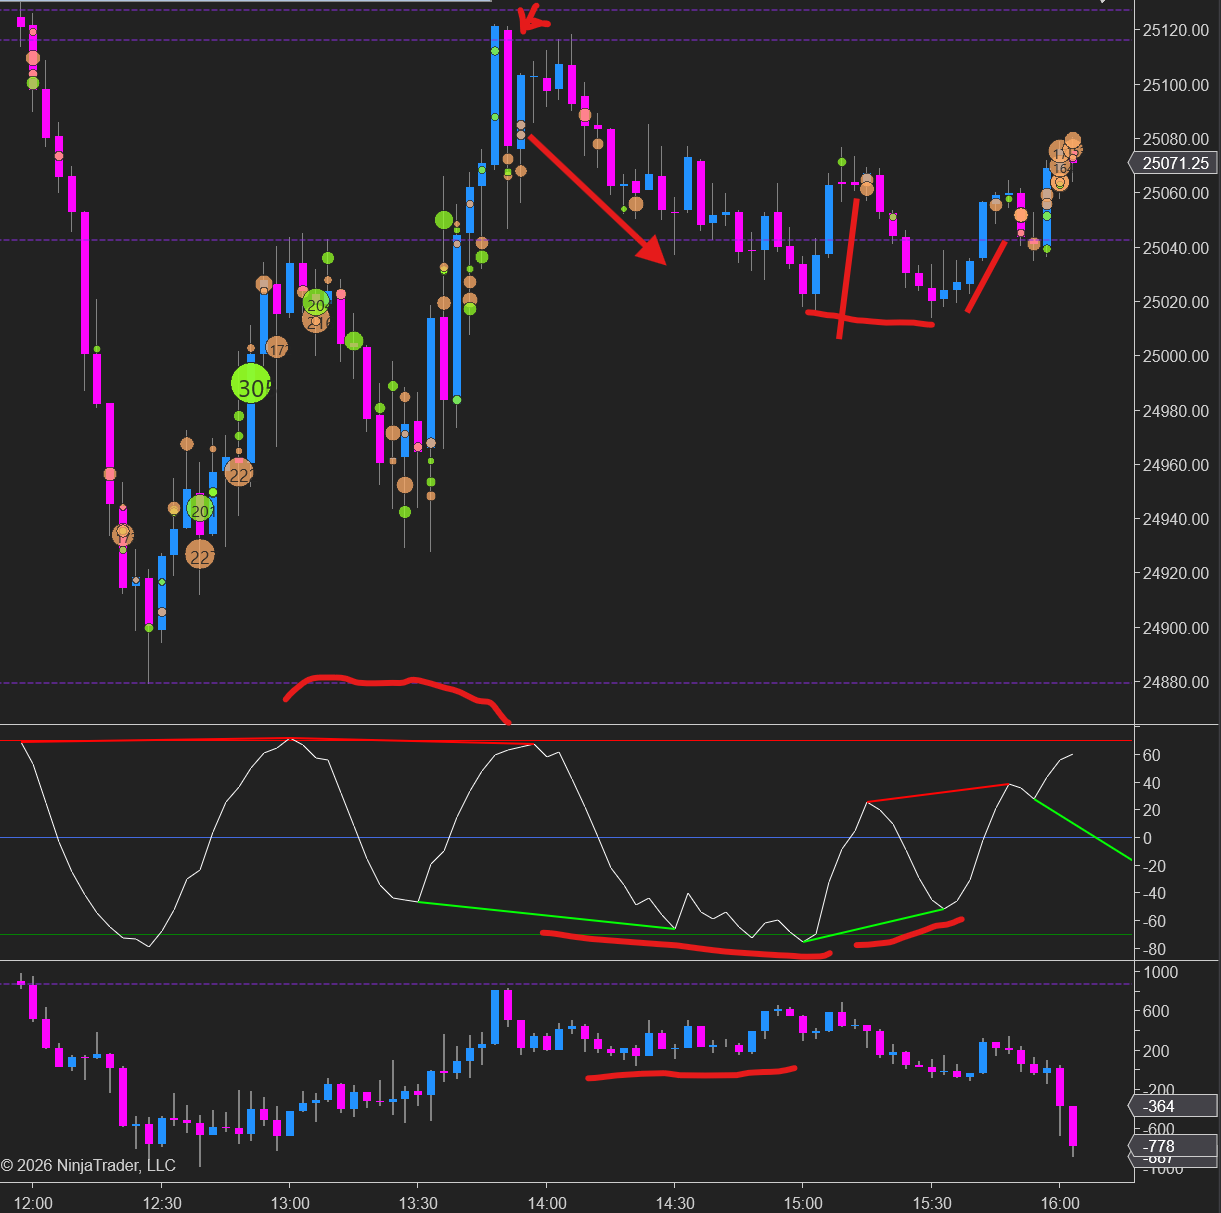
following my topic above of the strategy I use, here is an exemple for a quick demo on how to use it. Qmomentum + Volume profile on 15min + Big trades = look for divergence patterns on Q momentu, from a catalyst from big trades to see where big traders are on oyur side, absorbing, trapping etc then refer to a logical level, and go for it. Wedges on divergences and channels work best, flags are good too, but needs a bit more practice for it.
-
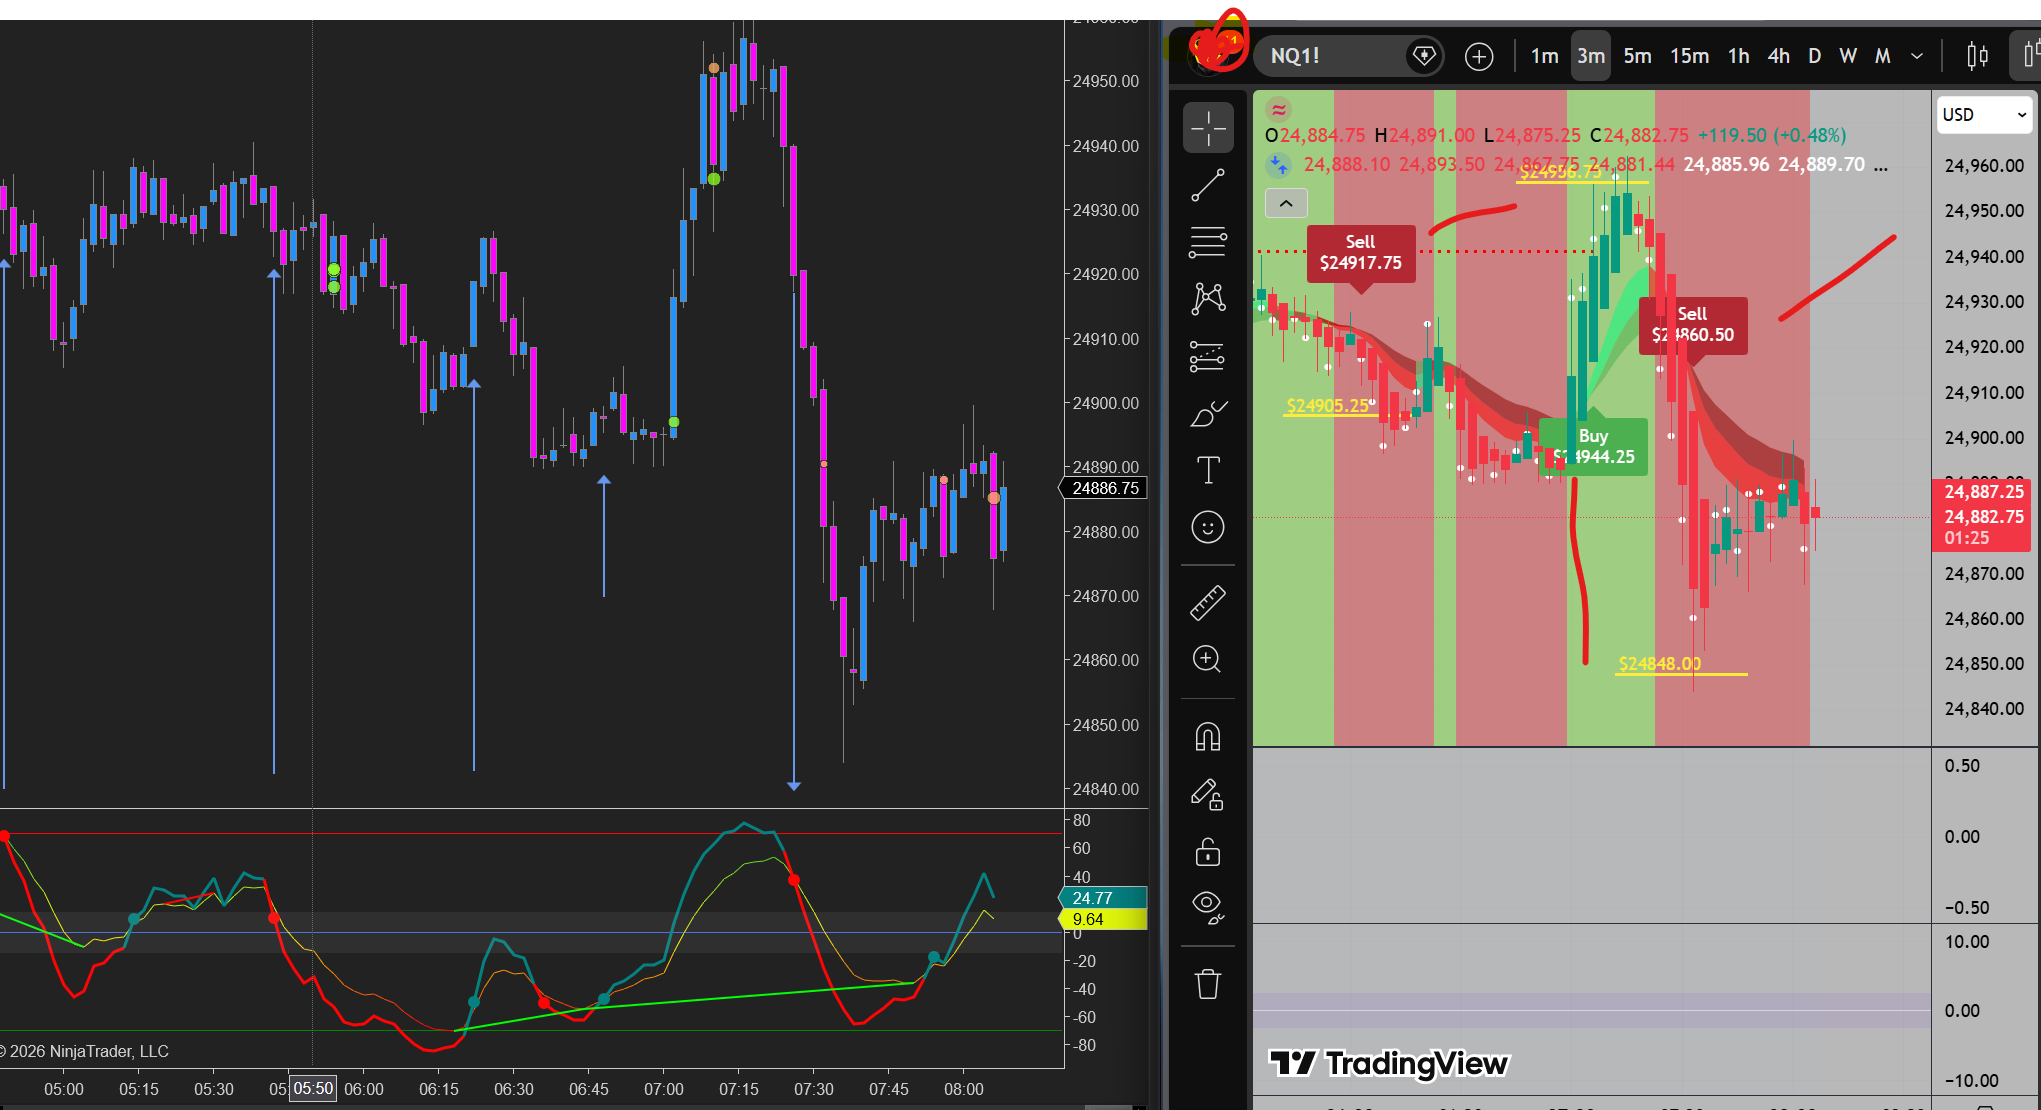
Alright. I use the Qmomentum on the 2 minute chart cause its the same replica as the SMM metrics thing. i configured the Q momentum on a 2 minute ans the trades come a bit early than the 3 minute on the SMM, so when the signal fires, this one is already in. mostly i scalp it between 32 to 50 ticks target and 28 stoploss or depending on the range I open the trades on the MNQ e fire 2 contracts and place stops below the range, this is paired with some price action and mainly the Divergence method on Qmomentum. Wedges are my favorite. to ignite this, I use the Big trades from Cluster delta and volume profile from Gomicators that fuels confluence to this setup. Pretty simple trading divergences with this setup. 2 to 3 setups a day is enough.
- 100 replies
-
- 10
-
-
Currently working on this with GPT. still a long way to go. its Orderflow based with martingale incorporated. its the Deltascalper thing but my own version converted into a strategy and some orderflow touch.
-
Thanks for this Ninja.. to the roof and beyond !
-
would be nice if we can get the full indicator file. lets see if someone has it.
-
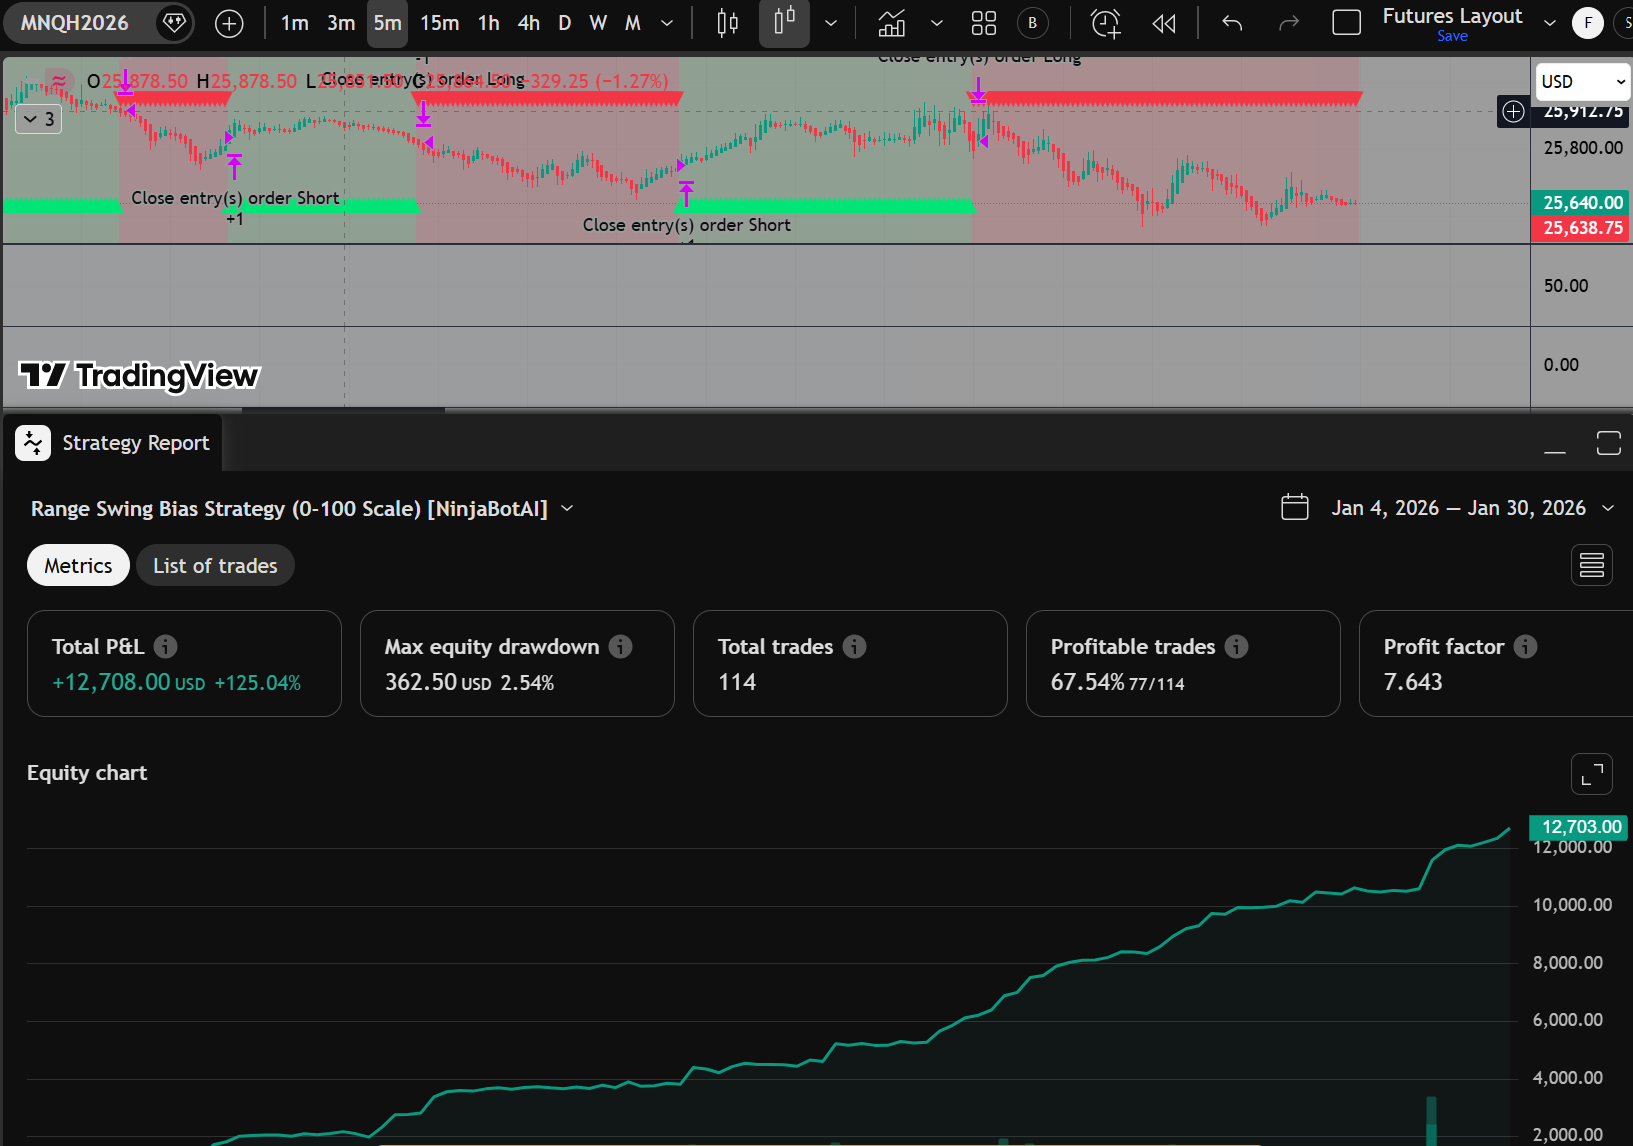
same as the Range bot from Ninja AI/ 5min HA candles, just plot it as it is and test it out ( MNQ or NQ 1 contract). thanks //@version=6 strategy("Range Swing Bias Strategy (0-100 Scale) [NinjaBotAI]", overlay=true, max_lines_count=500, max_labels_count=500, initial_capital=10000, default_qty_type=strategy.percent_of_equity, default_qty_value=10) // ───────────────────────────── // Inputs // ───────────────────────────── swingPeriod = input.int(15, "Swing Period", minval=1) swingMultiplier = input.float(4, "Swing Multiplier", step=0.1) lookback = input.int(50, "Normalization Lookback") // for 0-100 scaling showSwingLine = input.bool(true, "Show Swing Line") colorBg = input.bool(false, "Color Background by Bias") takeProfitPerc = input.float(2.0, "Take Profit (%)", step=0.1) stopLossPerc = input.float(1.0, "Stop Loss (%)", step=0.1) // ───────────────────────────── // Double-smoothed price change // ───────────────────────────── priceChange = math.abs(close - close[1]) fastEMA = ta.ema(priceChange, swingPeriod) slowPeriod = swingPeriod * 2 - 1 slowEMA = ta.ema(fastEMA, slowPeriod) // ───────────────────────────── // Swing line calculation // ───────────────────────────── bandwidth = slowEMA * swingMultiplier var float swingLine = na swingLine := na(swingLine[1]) ? close : close - bandwidth > swingLine[1] ? close - bandwidth : close + bandwidth < swingLine[1] ? close + bandwidth : swingLine[1] // ───────────────────────────── // Directional bias (slope-based) // ───────────────────────────── var int bias = 0 s = swingLine bias := s > s[1] ? 1 : s < s[1] ? -1 : bias[1] // ───────────────────────────── // Normalize swing line to 0-100 scale // ───────────────────────────── minSwing = ta.lowest(swingLine, lookback) maxSwing = ta.highest(swingLine, lookback) swingScaled = maxSwing != minSwing ? 100 * (swingLine - minSwing) / (maxSwing - minSwing) : 50 // ───────────────────────────── // Plotting // ───────────────────────────── plot(showSwingLine ? swingScaled : na, "Swing Line (0-100)", color=bias == 1 ? color.lime : color.red, linewidth=2) hline(50, "Midline", color=color.gray, linestyle=hline.style_dotted) bgcolor(colorBg ? (bias == 1 ? color.new(color.green, 85) : color.new(color.red, 85)) : na) plotchar(bias == 1, title="Bullish Bias", char="▲", location=location.bottom, color=color.lime, size=size.tiny) plotchar(bias == -1, title="Bearish Bias", char="▼", location=location.top, color=color.red, size=size.tiny) // ───────────────────────────── // Strategy Logic (swing slope-based) // ───────────────────────────── longCondition = bias == 1 and bias[1] != 1 // enters long only when bias flips to bullish shortCondition = bias == -1 and bias[1] != -1 // enters short only when bias flips to bearish // Exit levels based on percentage longStop = close * (1 - stopLossPerc / 100) longTP = close * (1 + takeProfitPerc / 100) shortStop = close * (1 + stopLossPerc / 100) shortTP = close * (1 - takeProfitPerc / 100) // Close opposite position first before opening new if longCondition strategy.close("Short") strategy.entry("Long", strategy.long, stop=longStop, limit=longTP) if shortCondition strategy.close("Long") strategy.entry("Short", strategy.short, stop=shortStop, limit=shortTP)
-
- 2
-
-
currently developing a strategy for the indicator on TDV. Needs more progress and backtesting.
-
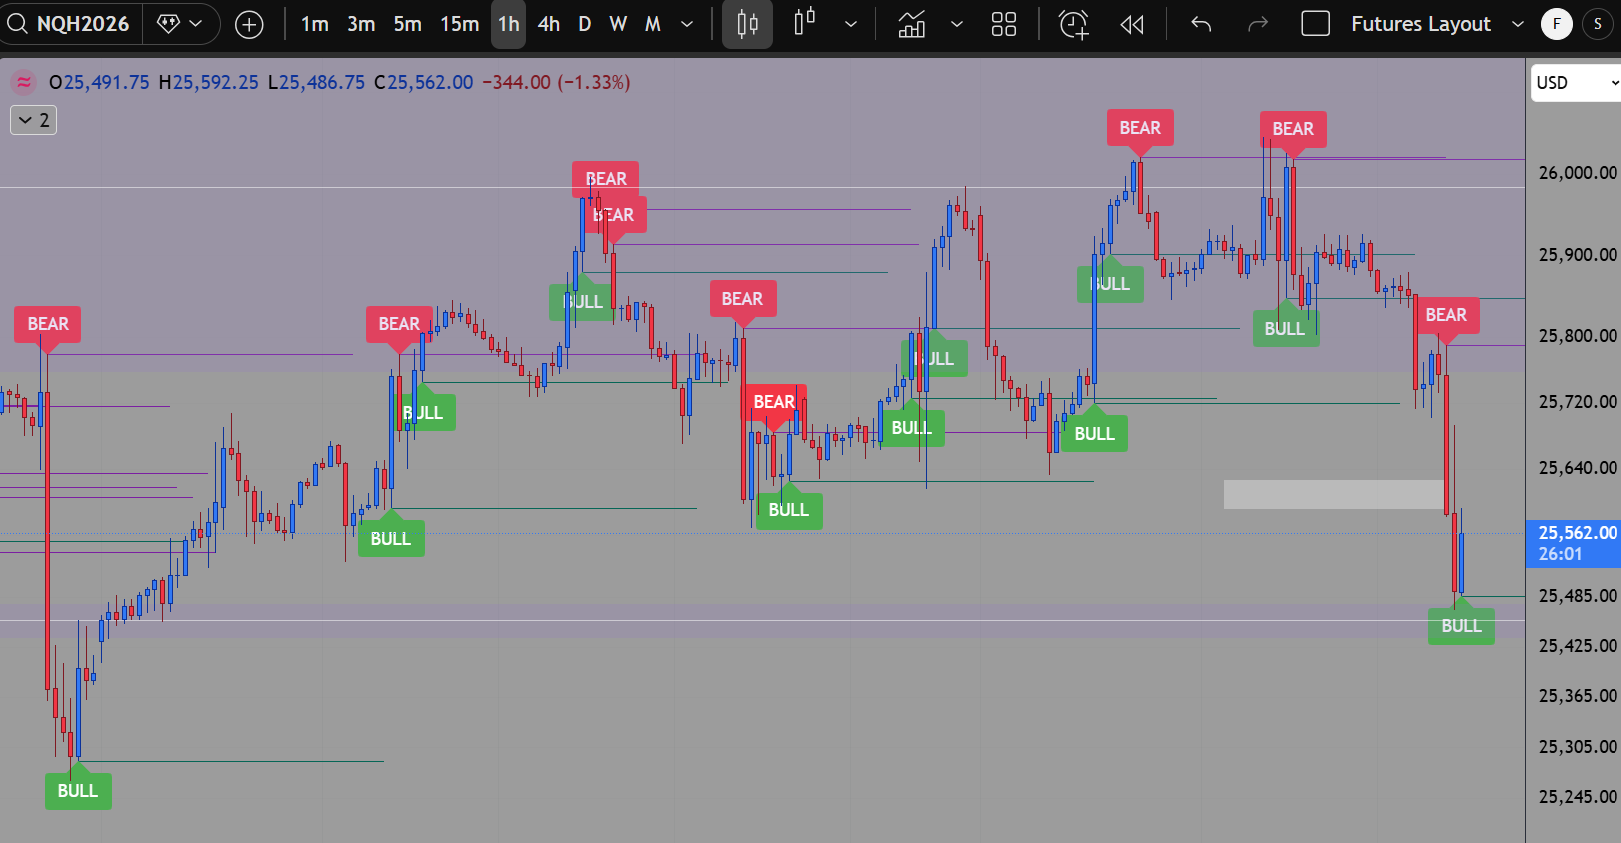
I will say this again. I create my own version of this DeltaScalper. this is to mirror the indicator, it is not the same. Leaving the TV code for some that already asked for: //@version=6 indicator("Clean Color Custom Imbalance", overlay=true) // Inputs int volumePeriod = input.int(20, "Volume Lookback") float volumeMultiplier = input.float(1.5, "Volume Multiplier") // COLOR OPTIONS color bullLineColor = input.color(color.green, "Bullish Line Color") color bearLineColor = input.color(color.red, "Bearish Line Color") color bullLabelColor = input.color(color.green, "Bullish Label Color") color bearLabelColor = input.color(color.red, "Bearish Label Color") color textColor = input.color(color.white, "Text Color") // STYLE OPTIONS int lineWidth = input.int(2, "Line Width", minval=1, maxval=5) int lineLength = input.int(40, "Line Length") // Detection float avgVolume = ta.sma(volume, volumePeriod) bool highVolume = volume > avgVolume * volumeMultiplier float bodyRatio = math.abs(close - open) / (high - low) bool strongBullish = highVolume and close > open and bodyRatio > 0.6 bool strongBearish = highVolume and close < open and bodyRatio > 0.6 // Draw imbalances if strongBullish line.new(bar_index, low, bar_index + lineLength, low, color=bullLineColor, width=lineWidth) label.new(bar_index, low, "BULL", color=bullLabelColor, textcolor=textColor, style=label.style_label_up) if strongBearish line.new(bar_index, high, bar_index + lineLength, high, color=bearLineColor, width=lineWidth) label.new(bar_index, high, "BEAR", color=bearLabelColor, textcolor=textColor, style=label.style_label_down)
-
Check if everything is ok. https://workupload.com/file/2W2UD9Hkhn2
-
created also for TDview
-
Not too sure but it seems like it could be from Valtos.. but cannot confirm. Got the file only. I am testing since last night and seems like a good scalp for one bar or a u shape.. wait the signal to be violated and then take the signal.. and with the picture above seems doing well as good support and resistance areas... combining this with KISS OF, volume delta and Volume profile.
-
Make sure you enable tick replay and have at least 3 days of data on your chart. Good use on the 2000 volume chart and 4 minute chart. scalping the next candle, or wait for the signal candle to be violated high or low of the signal and then reverse too. Also great for support and resistence, will leave here a 5 min chart with boxes show that. DeltaScalperNT8.zip
- 16 replies
-
- 17
-
-