⤴️-Paid Ad- Check advertising disclaimer here. Add your banner here.🔥

Quaderr
-
Posts
8 -
Joined
-
Last visited
Content Type
Profiles
Forums
Articles
Everything posted by Quaderr
-
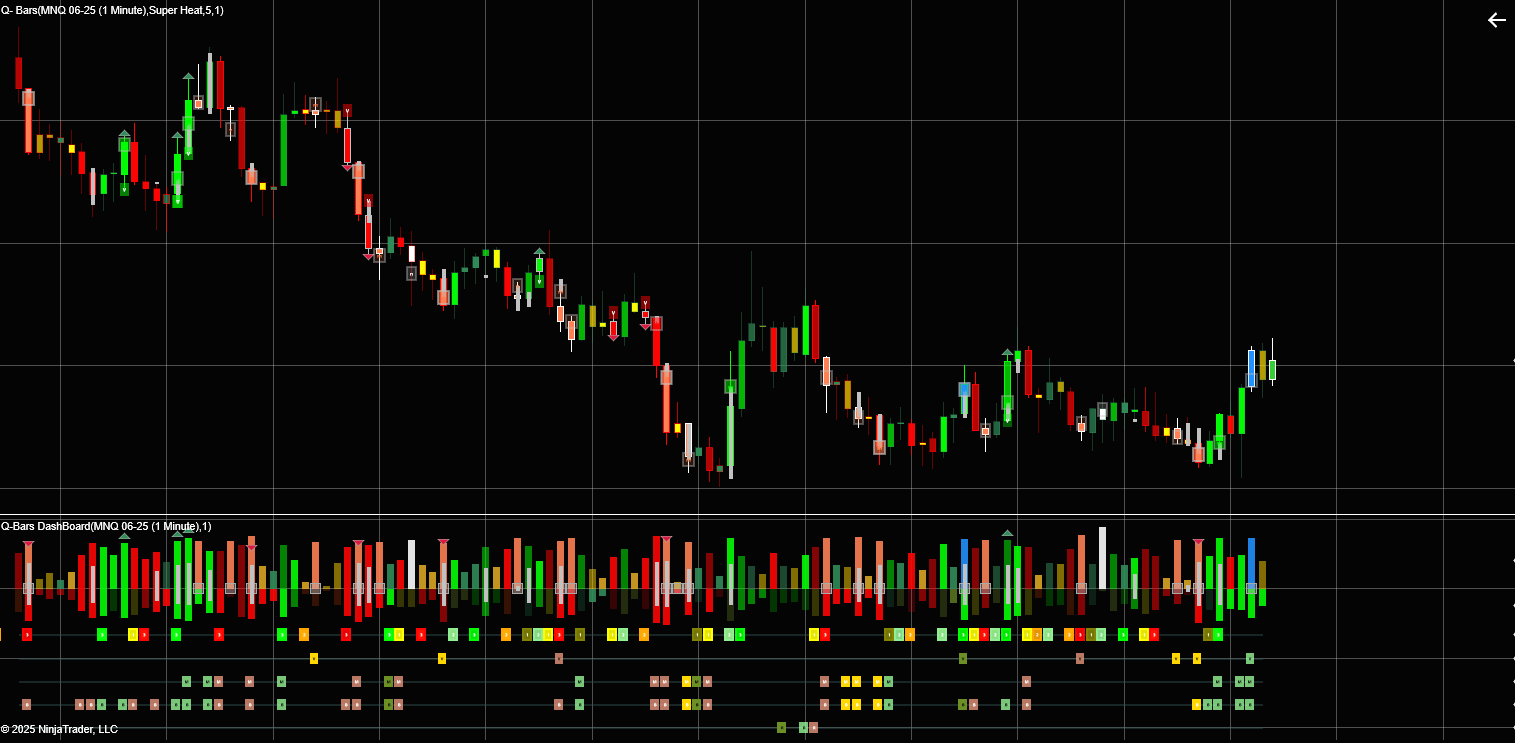
Q-Bars Smart Bars analyses the interest ( Volume and other variables) to show us areas of support and resistance as well as areas of No interest. These are levels where the interest dries up, Kind of the calm before the storm. Heat is mostly focused on measuring the Momentum and Trend variables. Showing us how strong or weak these variables are. We have also added our Power Wicks indicator to the mix. This indicator looks at the delta of buying and selling pressure and the shifts therein. Combining these indicators allow us to get the right information regarding the Smart Money Volume Flow , The Momentum , High Interest and No interest Levels , Trend strength , Momentum , Delta and more. When we put it all together we get some really good trading signals. The Market tends to move between areas of interest and No interest, Momentum or Trend, and then areas of Support and Resistance. Absorption and Distribution. Momentum and Reversion. Multi Time-Frame We get this information for every bar but we also look at this information at larger scales. We use the info gathered intra-bar to define trends and then measure this information on a larger “trend scale” The information that we get form individual bars give us the information at a Micro scale. Then we add these up in individual trends to give us information about the Macro scale. 4 Bar Types We define 4 unique bar types to explain these variables: Volume Bars (High Interest Bars) No Interest Bars Momentum Bars Balance Bars We then assign colors for all the bars in between according to their “heat” or their significance in terms of all the variable that we are interested in. These colors range from light colors to darker colors showing how significant these bars are. To learn more about this amazing tool visit: https://quaderr.com/q-bars/ See what our happy clients are saying about this tool: Detailed Review: "My journey in trading spanned 15 years, marked by persistent challenges in achieving consistent profitability. That trajectory shifted dramatically upon discovering Quaderr Indicators. Jaco, through his innovative Q Bar and Q Bar Dashboard, has truly been a 'lifesaver,' fundamentally altering my perspective on market analysis and dynamics. The Q Bar and Q Bar Dashboard are, in my experience, exceptionally potent tools. They form the core of a highly effective and robust trading system that I've found to perform remarkably well across diverse market environments. What truly sets these indicators apart is their unique ability to simplify complex market data, presenting it with a clarity that fosters actionable insights. Beyond the sophisticated design of the indicators themselves, Jaco's commitment to user education is highly commendable. He has meticulously ensured that I possess a thorough and practical understanding of how to leverage his tools effectively. This focus on clear instruction and the intuitive craftsmanship embedded in each indicator speak volumes about his dedication to empowering traders. I am immensely thankful and grateful to Jaco for generously sharing his profound knowledge and invaluable tools. For any individual aspiring to become a professional trader, I unequivocally recommend Quaderr Indicators as a truly special and transformative resource." Sincerely, Don Harris

-
Good day all Today we are looking at our Q-Next Indicator: Q-Next accurately detects trend changes and estimate the Next support or resistance level as the trend develops. As a resistance level gets broken it finds the next resistance level higher. Vice Versa for down trends. When a trend is perceived to be failing it adjusts the support or resistance against the trend. Q-Next adjust to: Periods of volatility shocks. Slow trending periods. Fast trending periods. Periods when the market is range bound. It has 4 optimization parameters that needs to be optimized to accurately filter out the noise, detect the trend and model the indicator to the instrument`s unique characteristics. You can download it for free here: https://quaderr.com/downloads/q-next/
-
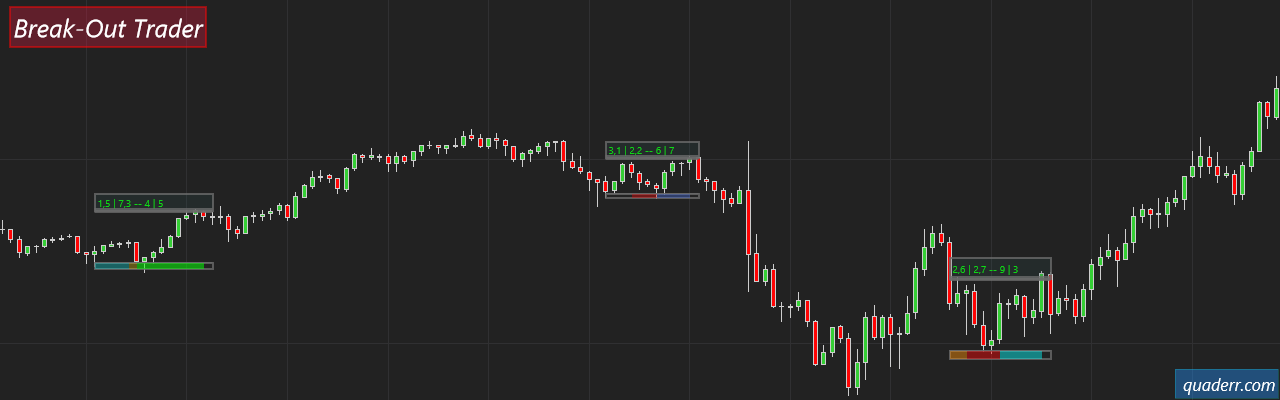
 Q-Scalper by Quaderr is a trading tool designed to identify and validate support and resistance levels for more precise trading decisions. It works by: Detecting Key Levels: Finds significant support and resistance zones and filters out noise. Momentum Diamonds: Highlights strong market momentum, helping confirm breakouts. Dynamic Trendlines: Identifies trendline breaks that could lead to profitable trades. Bar Color System: Uses color-coded bars to indicate trend strength (e.g., blue for strong uptrend, red for strong downtrend). Trade Entry & Exit Signals: Helps traders enter trades when price exits a marked range and suggests stop-loss placements. Click the link below to learn more about SR levels, how to trade this indicator and what current users are saying. https://quaderr.com/q-scalper/ This indicator is available at a 50% discount for today only, use discount code SCALPER50 at checkout to get yours today.
-
- 1
-

-
- new
- ninjatrader
- (and 2 more)
-
Please note, once you have downloaded the free indicators, please email your machine id to [email protected] Your licenses will then be activated and you will be notified via email. Happy Trading
-
Visit quaderr.com to purchase an all access pass, which allows you to trial 10 premium products. Should you wish to purchase a product after your trial period, your initial payment will be deducted from the product's price.
-
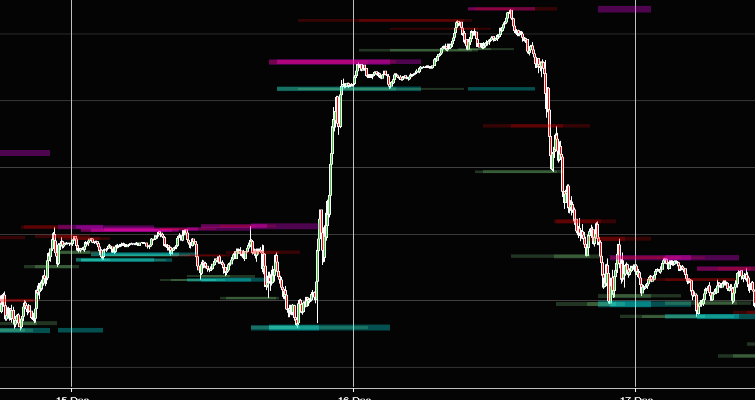
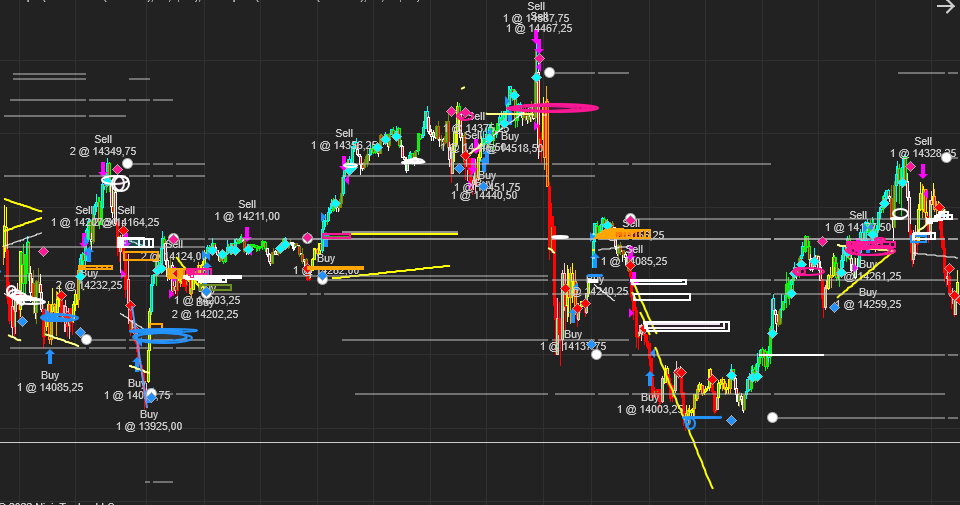
Greetings all members Today I would like to showcase our Free QSR Indicator. Support and Resistance (SR) levels are levels where the market found it hard to move beyond that level. These levels often determine ranges where the markets will move within or between. When the market breaks above or below these significant levels we can generally expect a big move. When the markets fail to break these levels we can generally expect the market to revert from these levels back to some other level. How to Trade it? Entries: When the market approaches a SR level we wait to see whether the market pulls back from this level or breaks out through this level. So when the market breaks above the resistance level you have a break out and you go long. When the market fails to break a resistance level you have a reversion trade and you can short the market. The opposite is true for support levels. Exits: Support and Resistance levels provides us with good profit target levels. Exit a long trade at a resistance level above your entry level and exit a short trade at a support level below your entry price. Stoplosses: It works well to place your stoploss at your SR level below your entry price for a long and at a level above your entry price for a short. You can trail this stoploss upwards in a long trade as the market breaks above resistance levels by moving your stoploss level upwards along with the break outs of these resistance levels. For more info and to download this great tool visit: https://quaderr.com/q-sr/
-
I respect the fact that you would want to be safe, but I am the business development manager at Quaderr. You can have a look at our website here: https://quaderr.com/ and navigate to free indicators and download the file from there if you do not trust this link.
-
Greetings to all members. To gain access to amazing free indicators for NinjaTrader 8 simply visit: https://quaderr.com/free-indicators/ Choose from 13 Free indicators and once downloaded you will also receive an email with a $50 store credit to redeem on any lifetime license of any product. To get you started, find below the file for Quaderr VWAP, a free indicator from Quaderr. QuaderrVWAP.zip
.png.eecb9b74a4bbde165a864613a7d927fb.png)