⤴️-Paid Ad- Check advertising disclaimer here. Add your banner here.🔥
All Activity
- Past hour
-

HFMarkets (hfm.com): Market analysis services.
AllForexnews replied to AllForexnews's topic in Fundamental Analysis
Date: November 12, 2025. Bitcoin Holds the Line at $100,000: Support or Stall? After several weeks under selling pressure, Bitcoin seems to be finding its footing. The world’s largest cryptocurrency has paused its decline around the $100,000 level, an area reinforced by the 50-week simple moving average (SMA) and the lower Bollinger Band, two key indicators that often act as major long-term supports. This confluence suggests that BTC’s current range may represent a short-term floor, though momentum remains fragile. On the weekly chart, the Relative Strength Index (RSI) and Stochastic oscillator continue to trend lower, with the latter nearing oversold territory. The MACD also remains deep in negative territory, underlining persistent bearish sentiment. Yet, the daily chart shows tentative improvement. The Stochastic has begun recovering from oversold levels, while the RSI edges towards neutral ground. Meanwhile, the MACD lines are nearing a potential bullish crossover, a setup that, if confirmed, could open the door for renewed upside momentum. Key levels to watch: Support: $104,000 and $100,000 (50-week SMA and lower Bollinger Band) Resistance: $106,500 and $109,000 Bitcoin appears to be stabilising, but a convincing recovery will require sustained strength above the $109,000-$112,000 area. The Bigger Picture: Can the Bulls Reclaim Control? Bitcoin’s recent pause coincides with a modest recovery in risk appetite, a mix of technical consolidation and cautious macro optimism. Renewed hopes for a US government shutdown lifted crypto alongside equities. Still, this isn’t a story of quick rebounds, it’s about whether the right combination of technical signals, liquidity, and investor sentiment can realign to invite bulls back before year-end. Fundamentals: A Market Catching Its Breath Hovering around the $100,000 psychological level, Bitcoin sits at a crucial point between consolidation and recovery. The short-term holder cost basis near $112,500 marks a key boundary, breaking above it could confirm renewed accumulation. Roughly 71% of BTC supply remains in profit, which historically signals a mid-cycle cooldown rather than a full bear market. Yet momentum has cooled: long-term holders have offloaded more than 300,000 BTC since July, a rare occurrence hinting at fatigue rather than panic. Despite the slowdown, the broader picture remains stable. The Relative Unrealised Loss ratio sits near 3%, suggesting traders remain defensive but not distressed. In essence, traders seem to be hedging exposure rather than exiting positions, a sign of consolidation, not collapse. BTC Market Structure: The Hidden Drivers of Volatility Beyond headlines and price swings, deeper market mechanics are shaping Bitcoin’s recent behaviour. Shifts in funding rates, collateral settings, and ETF hedging activity have become key drivers of short-term volatility. October’s shakeout, which wiped out nearly $19 billion in leveraged positions, underscored how changes in derivatives spreads can move Bitcoin as sharply as any macro event. When basis spreads widen, arbitrage traders tend to buy spot and short futures, reducing exchange supply and lifting prices. When those spreads compress, the unwind has the opposite effect, adding supply and pressure. ETF Flows: Demand Slowly Returns After six consecutive sessions of outflows totalling $660 million, US-listed Bitcoin ETFs have finally flipped back to net inflows, with around $240 million entering the market. While one day of green doesn’t erase a week of red, it signals a possible turning point, the largest institutional buyers may be shifting back to accumulation. ETF flows are now one of the clearest barometers of real demand. A sustained streak of five to ten days of inflows could ease mechanical sell pressure and re-establish a structural bid capable of pushing BTC back above key resistance levels around $112,000-$113,000. Until then, investors remain cautiously optimistic. Liquidity: The Hidden Bullish Catalyst The global liquidity backdrop is quietly becoming more supportive. The world’s broad money supply has climbed to a record $142 trillion, up nearly 7% year-on-year, while signals from the New York Fed suggest that quantitative tightening may soon pause, or even reverse. If central banks maintain looser liquidity conditions, Bitcoin could again act as a magnet for both speculative and institutional capital, mirroring earlier reflation phases when ample cash searched for higher returns in crypto and equities. Holder Activity: Conviction, Not Capitulation Recent headlines about ‘OG whale dumping’ only tell part of the story. On-chain data reveals that much of this movement stems from address upgrades, custody migrations, or collateral use, not mass liquidation. Meanwhile, ETF investors have shown remarkable resilience, holding through a 20% correction without significant withdrawals. The takeaway? Conviction hasn’t disappeared, it’s simply shifting hands, from long-time holders to more structured, institutional participants. As liquidity builds and ETF demand stabilises, Bitcoin’s foundation appears solid, even if sentiment is still recovering. Bitcoin Price Forecast: What’s Next for BTC? The $100,000 level remains a pivotal line in the sand. A decisive bounce from this zone could reinforce confidence among both short-and long-term participants. A confirmed move above $112,000 could open the path toward a broader recovery, possibly testing $120,000–$125,000 by year-end if ETF inflows persist and liquidity expands globally. Conversely, failure to defend the $100,000 level could trigger another retest toward $95,000, where strong historical support lies. For now, Bitcoin’s outlook remains cautiously bullish, supported by solid structural underpinnings but constrained by weak momentum. Traders and investors should continue to watch ETF flows, liquidity indicators, and key resistance levels to gauge whether this is simply a mid-cycle pause or the start of the next Bitcoin uptrend. For now, Bitcoin's outlook remains cautiously bullish , supported by solid structural underpinnings but constrained by weak momentum. Traders and investors should continue to watch ETF flows, liquidity indicators, and key resistance levels to gauge whether this is simply a mid-cycle pause or the start of the next Bitcoin uptrend . Always trade with strict risk management. Your capital is the single most important aspect of your trading business. Please note that times displayed based on local time zone and are from time of writing this report. Click HERE to access the full HFM Economic calendar. Want to learn to trade and analyze the markets? Join our webinars and get analysis and trading ideas combined with better understanding of how markets work. Click HERE to register for FREE! Click HERE to READ more Market news. Andria Pichidi HFMarkets Disclaimer: This material is provided as a general marketing communication for information purposes only and does not constitute an independent investment research. Nothing in this communication contains, or should be considered as containing, an investment advice or an investment recommendation or a solicitation for the purpose of buying or selling of any financial instrument. All information provided is gathered from reputable sources and any information containing an indication of past performance is not a guarantee or reliable indicator of future performance. Users acknowledge that any investment in Leveraged Products is characterized by a certain degree of uncertainty and that any investment of this nature involves a high level of risk for which the users are solely responsible and liable. We assume no liability for any loss arising from any investment made based on the information provided in this communication. This communication must not be reproduced or further distributed without our prior written permission. - Today
-
 ⭐ goldeneagle1 reacted to a post in a topic:
Eds Retrace Plan
⭐ goldeneagle1 reacted to a post in a topic:
Eds Retrace Plan
-
⭐ osijek1289 reacted to a post in a topic:
Eds Retrace Plan
-
@apmoo @kimsam
-
Hey Kimsam, Would you mind sharing that updated version please? Thanks
-
 ynr reacted to a post in a topic:
LegendaryTrader Indicator - Newest Versions
ynr reacted to a post in a topic:
LegendaryTrader Indicator - Newest Versions
-
hybrid76 reacted to a post in a topic:
TradeSaber Predator X OrderEntry LT V3.0.2.8
-
 hybrid76 reacted to a post in a topic:
LegendaryTrader Indicator - Newest Versions
hybrid76 reacted to a post in a topic:
LegendaryTrader Indicator - Newest Versions
-
does anyone have the breakout bot they offer or any others? thank you for any help
-
Can your share your predator template
-
That’s looks amazing
-
⭐ goldeneagle1 reacted to a post in a topic:
LegendaryTrader Indicator - Newest Versions
-
Overview (3).doc
-
EdsRetracePlan2025 (2).zipthere is no manual for it, but here is his newest version
-
Can one of our educators please check?
-
Starlet8223 reacted to a post in a topic:
F.u.t.e.x Live - Virtual Intensive Trader Training course
-
as the autoentry is a ATM type strategy you would only be able to do market replay to test, but the indicator has the FourTwoSignal exposed so I use Predator order entry strategy and use custom signal and can backtest any time period on a chart. so here is the last 20 days with 100 stop, 45 tgt 1 NQ in 1 min chart

-
 Hi everyone, I’m looking for the Virtual Intensive Trader Training course from F.u.t.e.x . If anyone has it, I’d really appreciate it if you could share it. Thanks a lot!
-
- 1
-
-
are these educated?
-
⭐ goldeneagle1 reacted to a post in a topic:
LegendaryTrader Indicator - Newest Versions
-
Thxs for sharing the details Any idea how to perform backtest with these Auto traders, I have tried but i am not getting any results.
-
Ninja448 reacted to a post in a topic:
LegendaryTrader Indicator - Newest Versions
-
Ninja448 reacted to a post in a topic:
LegendaryTrader Indicator - Newest Versions
-

roboforex Market Fundamental Analysis by RoboForex
RBFX Support replied to RBFX Support's topic in Fundamental Analysis
GBPUSD holds steady above 1.3100 The GBPUSD rate consolidated above 1.3100 despite rising unemployment in the UK. Discover more in our analysis for 12 November 2025. GBPUSD forecast: key trading points Market focus: UK unemployment rose to 5.0% in September Current trend: correcting upwards GBPUSD forecast for 12 November 2025: 1.3100 and 1.3250 Fundamental analysis Weaker-than-expected UK labour market data strengthened expectations of a Bank of England rate cut next month. Regular wage growth slowed to 4.6% in Q3, while unemployment rose to 5.0%, exceeding the forecast of 4.9%. Last week, the Bank of England kept interest rates unchanged but indicated that a rate cut in December would depend on how strong domestic inflationary pressure remains. The market is now awaiting the UK Q3 GDP figures, scheduled for release on Thursday. RoboForex Market Analysis & Forex Forecasts Attention! Forecasts presented in this section only reflect the author’s private opinion and should not be considered as guidance for trading. RoboForex bears no responsibility for trading results based on trading recommendations described in these analytical reviews. Sincerely, The RoboForex Team -
Market Technical Analysis by RoboForex
RBFX Support replied to RBFX Support's topic in Technical Analysis
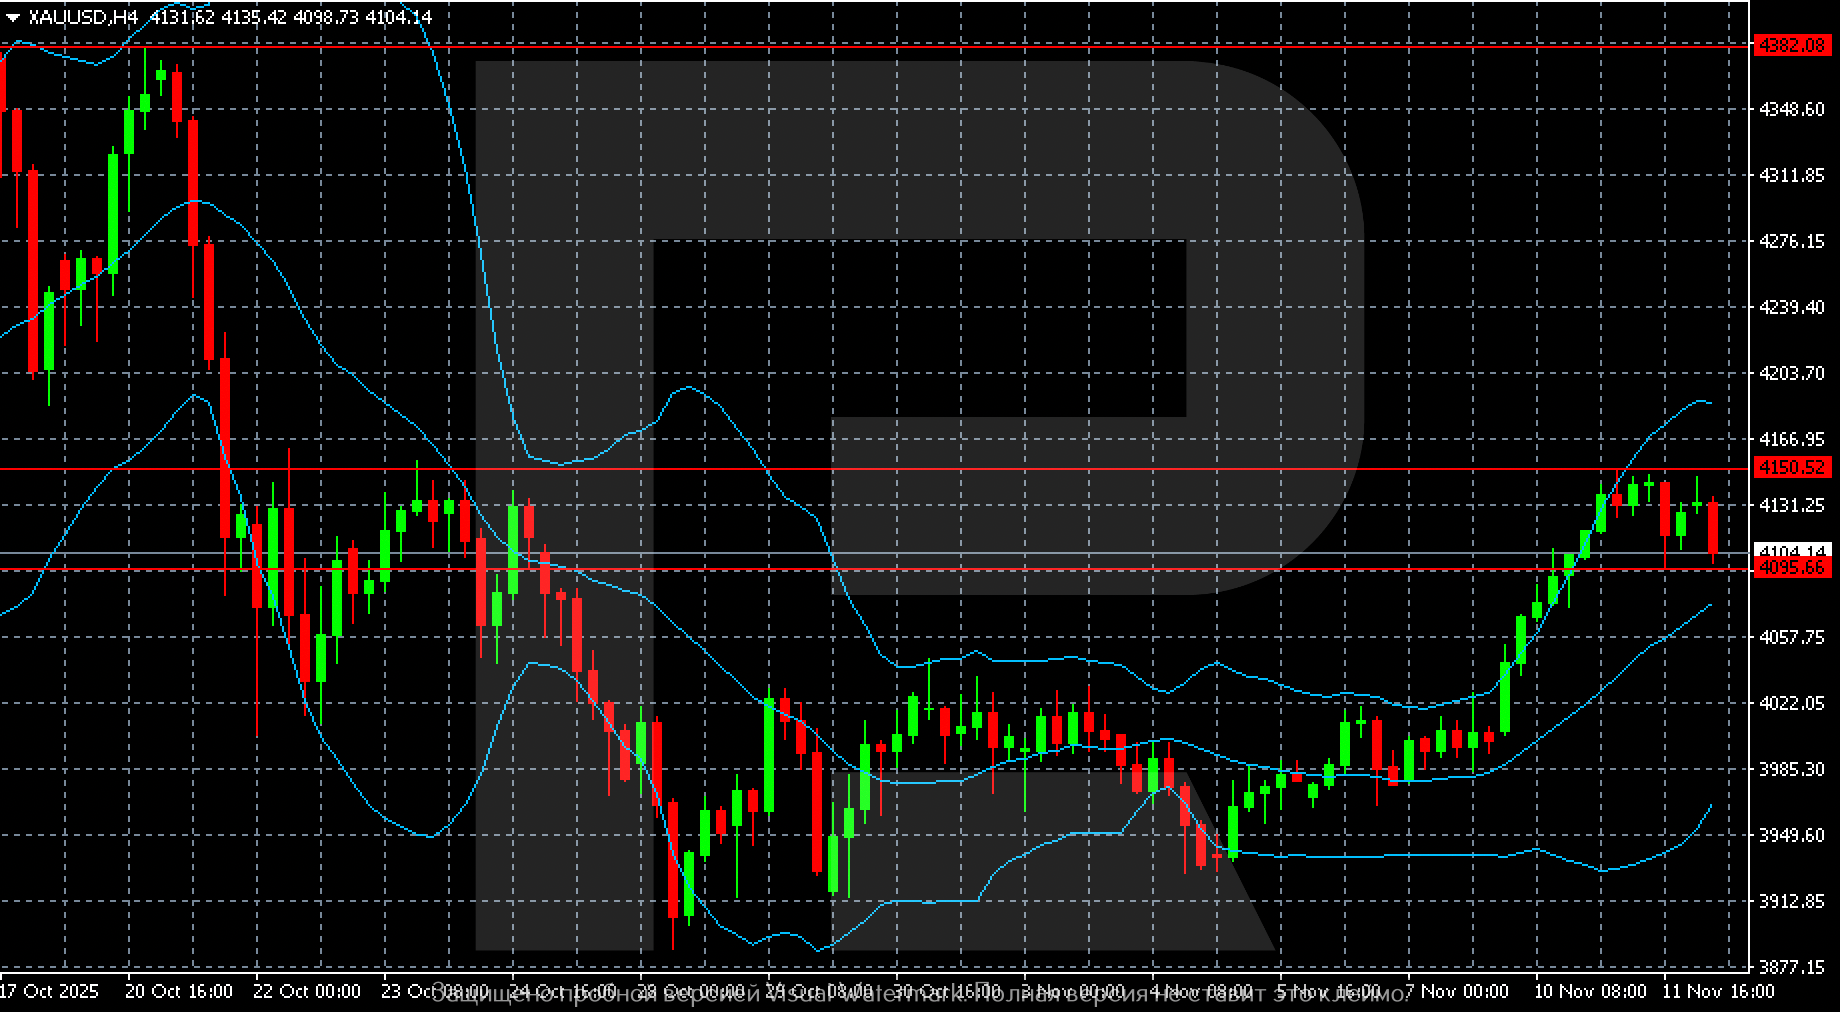
Gold (XAUUSD) on track for the strongest annual rally since 1979 Gold (XAUUSD) prices recovered to 4,130 USD as the market anticipates a Fed rate cut. Discover more in our analysis for 12 November 2025. XAUUSD technical analysis On the H4 chart, after a late-October decline, XAUUSD quotes stabilised within the 3,900–4,000 USD per ounce range, beginning a strong recovery from 8 November. Gold (XAUUSD) maintains a moderately bullish trend. Read more - Gold Forecast Attention! Forecasts presented in this section only reflect the author’s private opinion and should not be considered as guidance for trading. RoboForex bears no responsibility for trading results based on trading recommendations described in these analytical reviews. Sincerely, The RoboForex Team
-
 alyzarr joined the community
 -
Could anyone share the Michael S. Jenkins teaching material about the priavte seminars? Many thanks!
-
 jackson joined the community
 -
here is the new one: https://drive.google.com/drive/u/1/folders/14VI5q47NWdGeVuu0YBpcNZy_mRLkbmhO
- Yesterday
-
someone re up sbs and ultimate scalper
-
 with leverage 1:1000 your account is in margin call in a short time and without escape....only a masochist would cheat with that leverage
 -
for fvg chart trader, not ifvg
-
they only have a discord https://discord.gg/MTQUSTmA here's a video: https://www.loom.com/share/5bcc832a985d4852a6bcaccbe28f3d50
-
But why you need edu ninja for this ?
-
what is their website by the way??