⤴️-Paid Ad- Check advertising disclaimer here. Add your banner here.🔥
All Activity
- Past hour
-
 AllIn reacted to a post in a topic:
lastest predator 3.6.2 needs to edu
AllIn reacted to a post in a topic:
lastest predator 3.6.2 needs to edu
-
 ⭐ ralph kabota reacted to a post in a topic:
MZ Pack 3.18.28+ *Required*
⭐ ralph kabota reacted to a post in a topic:
MZ Pack 3.18.28+ *Required*
- Today
-
kimsam reacted to a post in a topic:
Bot AI Tdview
-
RedVenom reacted to a post in a topic:
maverickindicators.com
-
Thanks a lot. Appreciate it.
-
 RedVenom joined the community
 -
⭐ MOF NET reacted to a post in a topic:
Metastock 20 realtime c*****d
-
⭐ MOF NET reacted to a post in a topic:
Metastock 20 realtime c*****d
-

BinancePlus NinjaTools Addon for Binance Futures Exchange
wahabdeen2 replied to wahabdeen2's topic in Ninja Trader 8
Any help -
⭐ osijek1289 reacted to a post in a topic:
MZ Pack 3.18.28+ *Required*
-
 Puzzle reacted to a post in a topic:
Metastock 20 realtime c*****d
Puzzle reacted to a post in a topic:
Metastock 20 realtime c*****d
-
@N9T @apmoo Thanks 🙏
-
https://workupload.com/file/CgN8LtTJN2D
-
link doesn't work anymore. Can anyone please reupload. Thank you
-
@hammyy2k You are amazing brother! Thank you 🙂
-
English only last warning
-
 Nikdouv joined the community
 -
Here is 3.18.31 EDU included MZpack.NT8 3.18.31.rar
-
https://workupload.com/file/FVtatefVddc These robots perform well; if you could help by educating them, I believe they have an expiration date... Also, if possible, could you send the open-source code? Because that way I can help and adapt it for other assets... Thanks @redux@kimsam@nt9
-
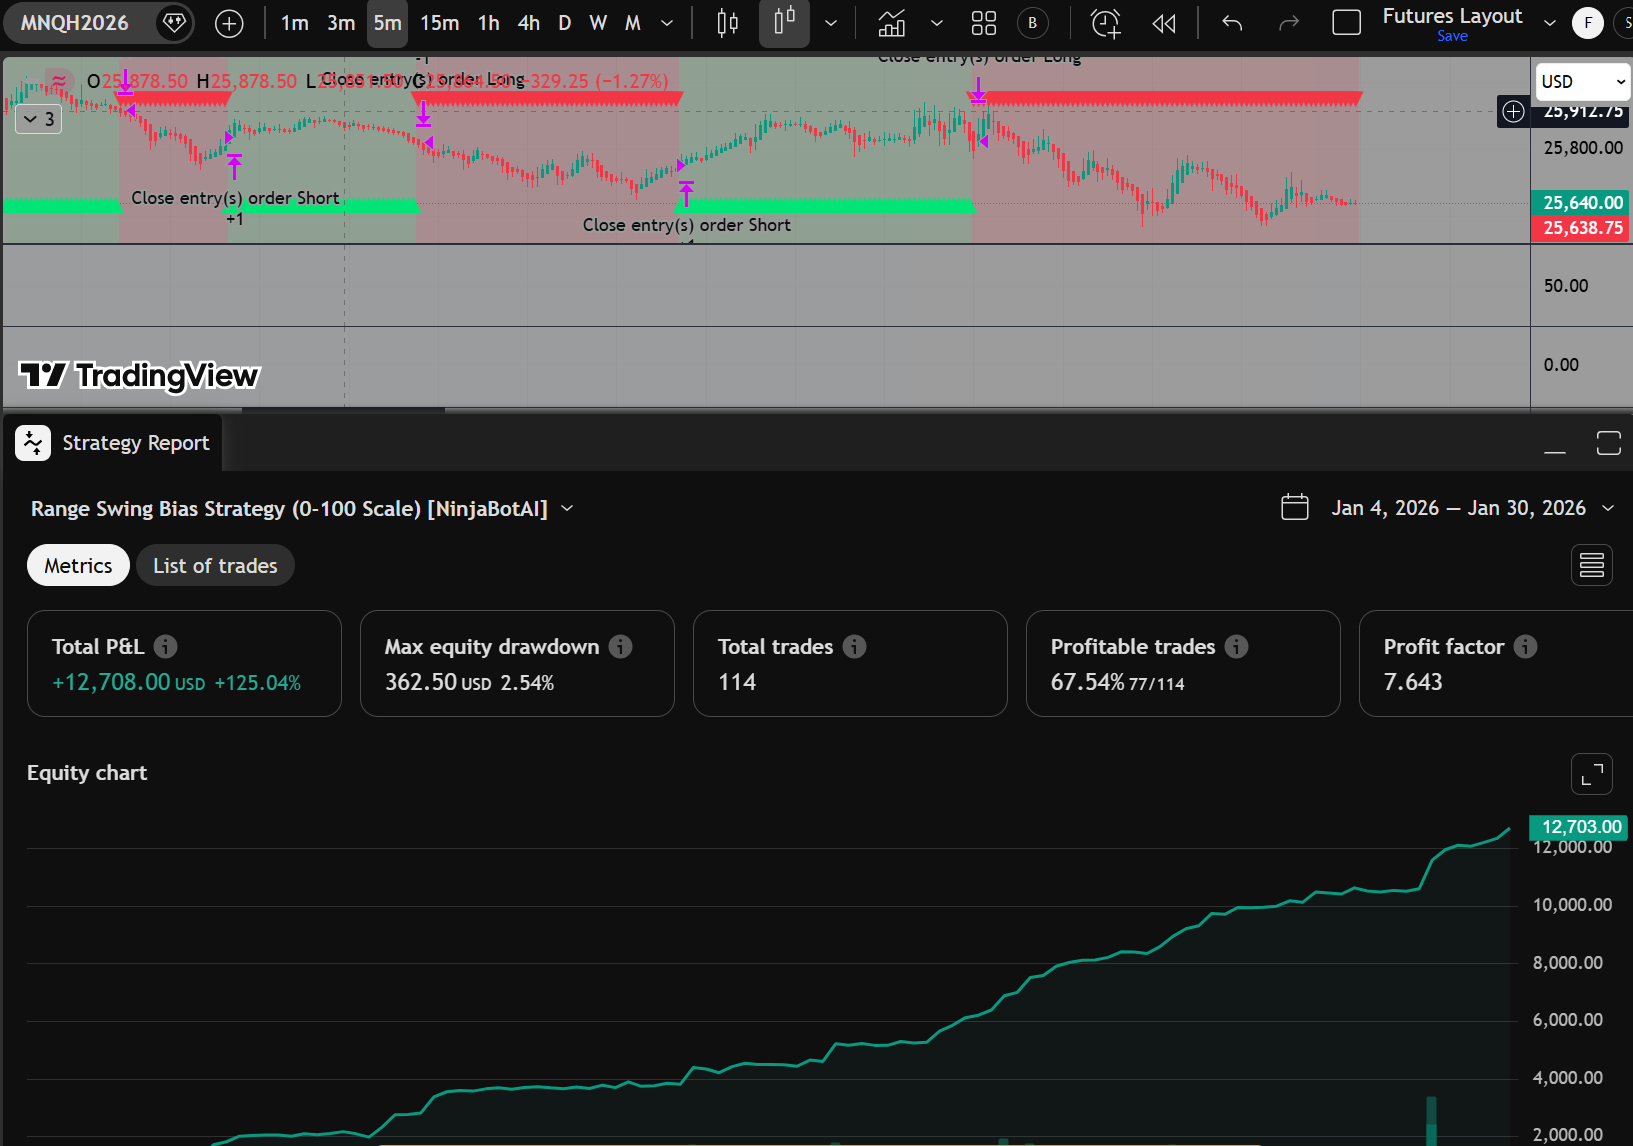
same as the Range bot from Ninja AI/ 5min HA candles, just plot it as it is and test it out ( MNQ or NQ 1 contract). thanks //@version=6 strategy("Range Swing Bias Strategy (0-100 Scale) [NinjaBotAI]", overlay=true, max_lines_count=500, max_labels_count=500, initial_capital=10000, default_qty_type=strategy.percent_of_equity, default_qty_value=10) // ───────────────────────────── // Inputs // ───────────────────────────── swingPeriod = input.int(15, "Swing Period", minval=1) swingMultiplier = input.float(4, "Swing Multiplier", step=0.1) lookback = input.int(50, "Normalization Lookback") // for 0-100 scaling showSwingLine = input.bool(true, "Show Swing Line") colorBg = input.bool(false, "Color Background by Bias") takeProfitPerc = input.float(2.0, "Take Profit (%)", step=0.1) stopLossPerc = input.float(1.0, "Stop Loss (%)", step=0.1) // ───────────────────────────── // Double-smoothed price change // ───────────────────────────── priceChange = math.abs(close - close[1]) fastEMA = ta.ema(priceChange, swingPeriod) slowPeriod = swingPeriod * 2 - 1 slowEMA = ta.ema(fastEMA, slowPeriod) // ───────────────────────────── // Swing line calculation // ───────────────────────────── bandwidth = slowEMA * swingMultiplier var float swingLine = na swingLine := na(swingLine[1]) ? close : close - bandwidth > swingLine[1] ? close - bandwidth : close + bandwidth < swingLine[1] ? close + bandwidth : swingLine[1] // ───────────────────────────── // Directional bias (slope-based) // ───────────────────────────── var int bias = 0 s = swingLine bias := s > s[1] ? 1 : s < s[1] ? -1 : bias[1] // ───────────────────────────── // Normalize swing line to 0-100 scale // ───────────────────────────── minSwing = ta.lowest(swingLine, lookback) maxSwing = ta.highest(swingLine, lookback) swingScaled = maxSwing != minSwing ? 100 * (swingLine - minSwing) / (maxSwing - minSwing) : 50 // ───────────────────────────── // Plotting // ───────────────────────────── plot(showSwingLine ? swingScaled : na, "Swing Line (0-100)", color=bias == 1 ? color.lime : color.red, linewidth=2) hline(50, "Midline", color=color.gray, linestyle=hline.style_dotted) bgcolor(colorBg ? (bias == 1 ? color.new(color.green, 85) : color.new(color.red, 85)) : na) plotchar(bias == 1, title="Bullish Bias", char="▲", location=location.bottom, color=color.lime, size=size.tiny) plotchar(bias == -1, title="Bearish Bias", char="▼", location=location.top, color=color.red, size=size.tiny) // ───────────────────────────── // Strategy Logic (swing slope-based) // ───────────────────────────── longCondition = bias == 1 and bias[1] != 1 // enters long only when bias flips to bullish shortCondition = bias == -1 and bias[1] != -1 // enters short only when bias flips to bearish // Exit levels based on percentage longStop = close * (1 - stopLossPerc / 100) longTP = close * (1 + takeProfitPerc / 100) shortStop = close * (1 + stopLossPerc / 100) shortTP = close * (1 - takeProfitPerc / 100) // Close opposite position first before opening new if longCondition strategy.close("Short") strategy.entry("Long", strategy.long, stop=longStop, limit=longTP) if shortCondition strategy.close("Long") strategy.entry("Short", strategy.short, stop=shortStop, limit=shortTP)

-
- 1
-
-
Looks like a good one
-
@apmoo @fryguy1 Please ReUpload Old Files Netpicks Obsindian Like stuff and Please Replay help us
-
Crack for Metastock 20 real time. https://workupload.com/file/hUwT9m4FMGj Thankyou to daddypenguin.
- 1 reply
-
- 7
-
-
-
Metastock 20 realtime c*****d https://e.pcloud.link/publink/show?code=XZ6qsAZK2otfBPXC0Sn1UJGxn4IL5Do1S9X
- 1 reply
-
- 7
-
-
-
thanks bro, but this version is old , new twst fusion has a scanner and a analyzer
-

Anyone can share twst fusion bot please
alpinestrading replied to trader04's topic in Ninja Trader 8
[Tradingchat.org] TWST.zip -
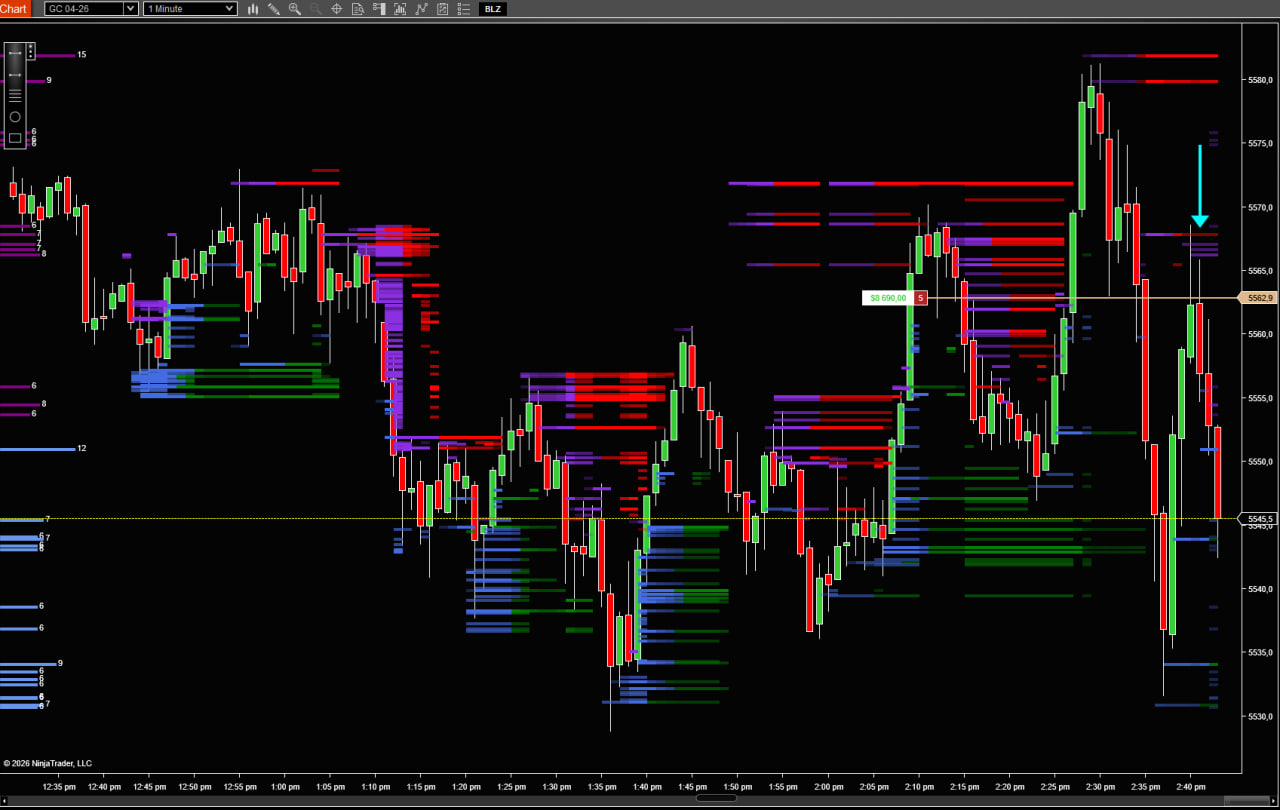
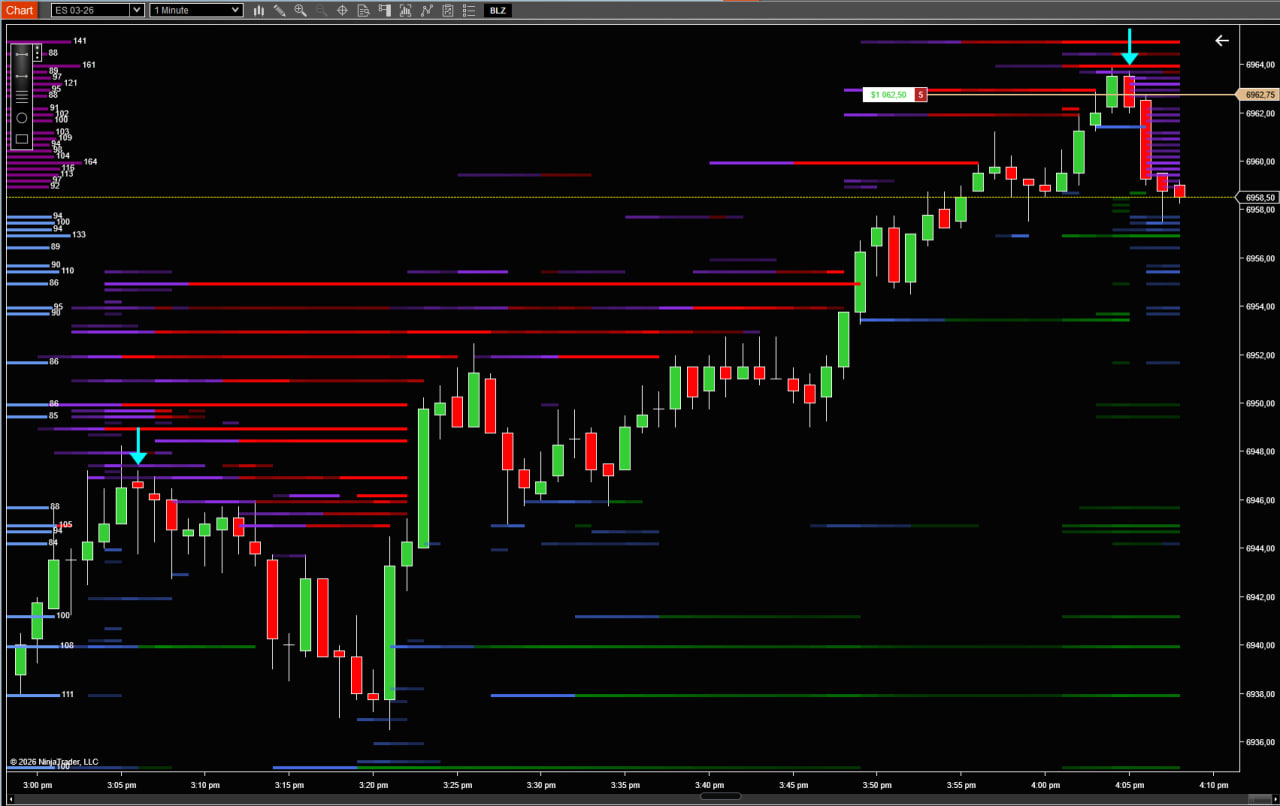
You need level 2 data. I use free tradovate account to help me load the free lvl 2 data. Just create a temp mail to use it for free. Then recreate temp mail after around 2 weeks. It's BSG Liquidity Zone. educated by @apmoo a big thank to him
-
Just to add on, the first photo is a safer trade as the liquidity has been taken out (same level as my entry) the second photo is a more risky trade as it's a fade entry off the top edge.
-
@LoneBladeRGC Which of the indicators do you have loaded in the above pictures and also, do you need level tow data?
-
I actually do. See the liquidity coming above you? I have sellers above me. I can now join in confidently knowing that I'm not selling alone. Another example See how they ran the liquidity at the top and filled in behind immediately afterwards. That's an instant sell. This is how I trade manually, all taken from my personal trade journal. Just to give some ideas as this community has given me much help.
-
After testing the InfinityAlgo Engine I can also confirm nothing pops up after I put it on my unedu 8.1.6.3 NT8. Shyan, do you happen to have a sonarlike icebergy indy that work with N9T's resource file (the 4387KB one)? Because that one you gave me earlier on cannot work with that resource file. Btw thank you @N9T for all your hard work and kind heart to help us.
- Yesterday
-
 Shadow changed their profile photo
 -
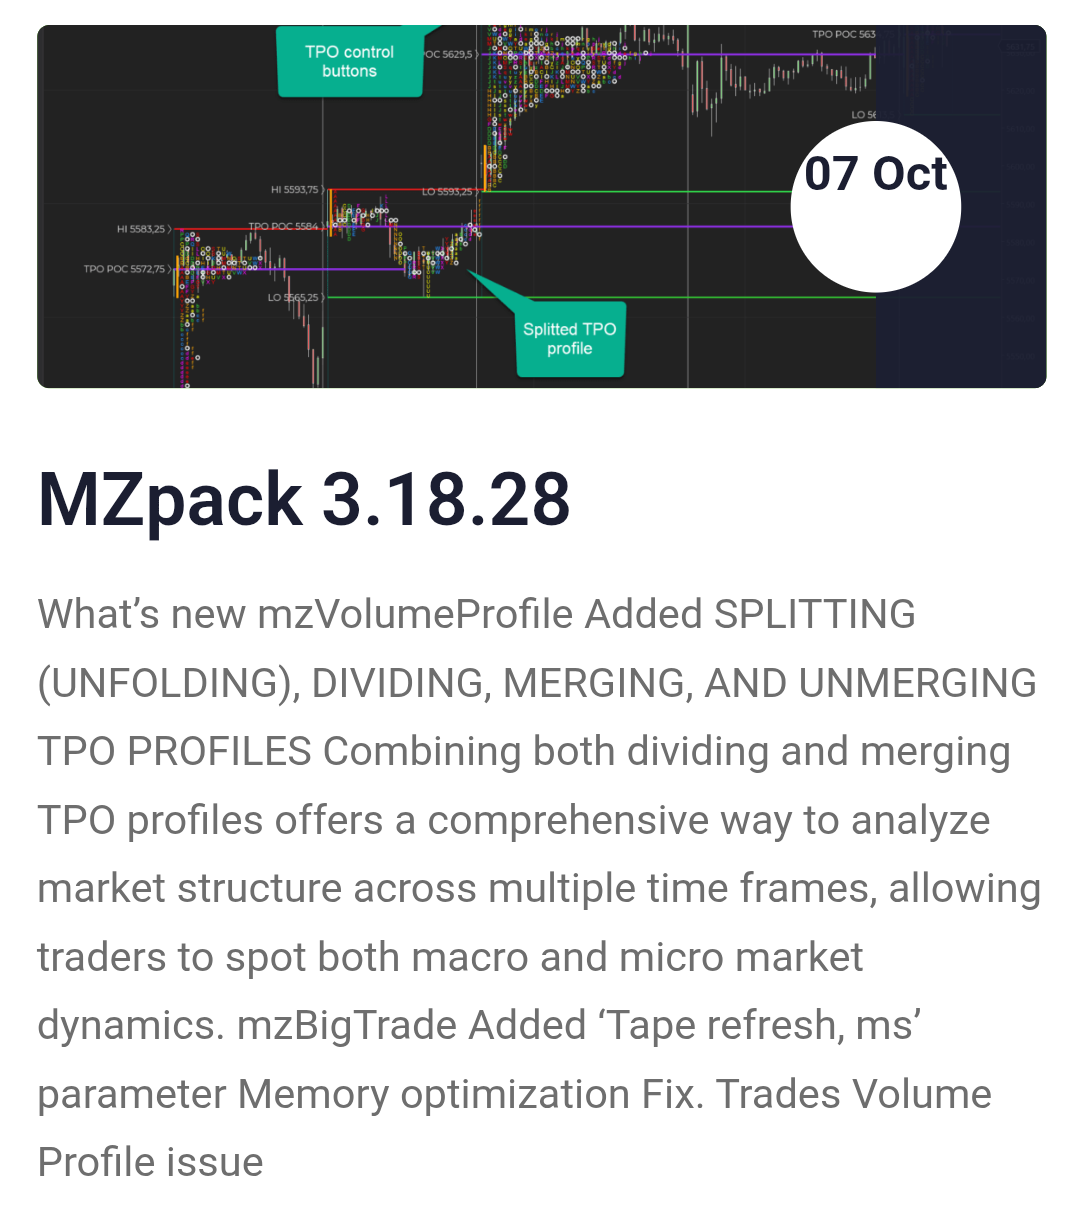
Hi, does anyone have MZPack 3.18.28 or above? (Not 3.18.8 as this is a much older version) It includes individual profile splitting, and so much more orderflow additions etc. Super super good TPO so is much superior to others shared here. If anyone could Edu or share it would be extremely appreciated! Thanks for all the help. @apmoo @kimsam
-
Why would you need this one? MZ pack is much better. A really good MP would be ACME 8 but can't find it educated for free anywhere. Jhon Snow sells the pack for quite cheap though