All Activity
- Past hour
-
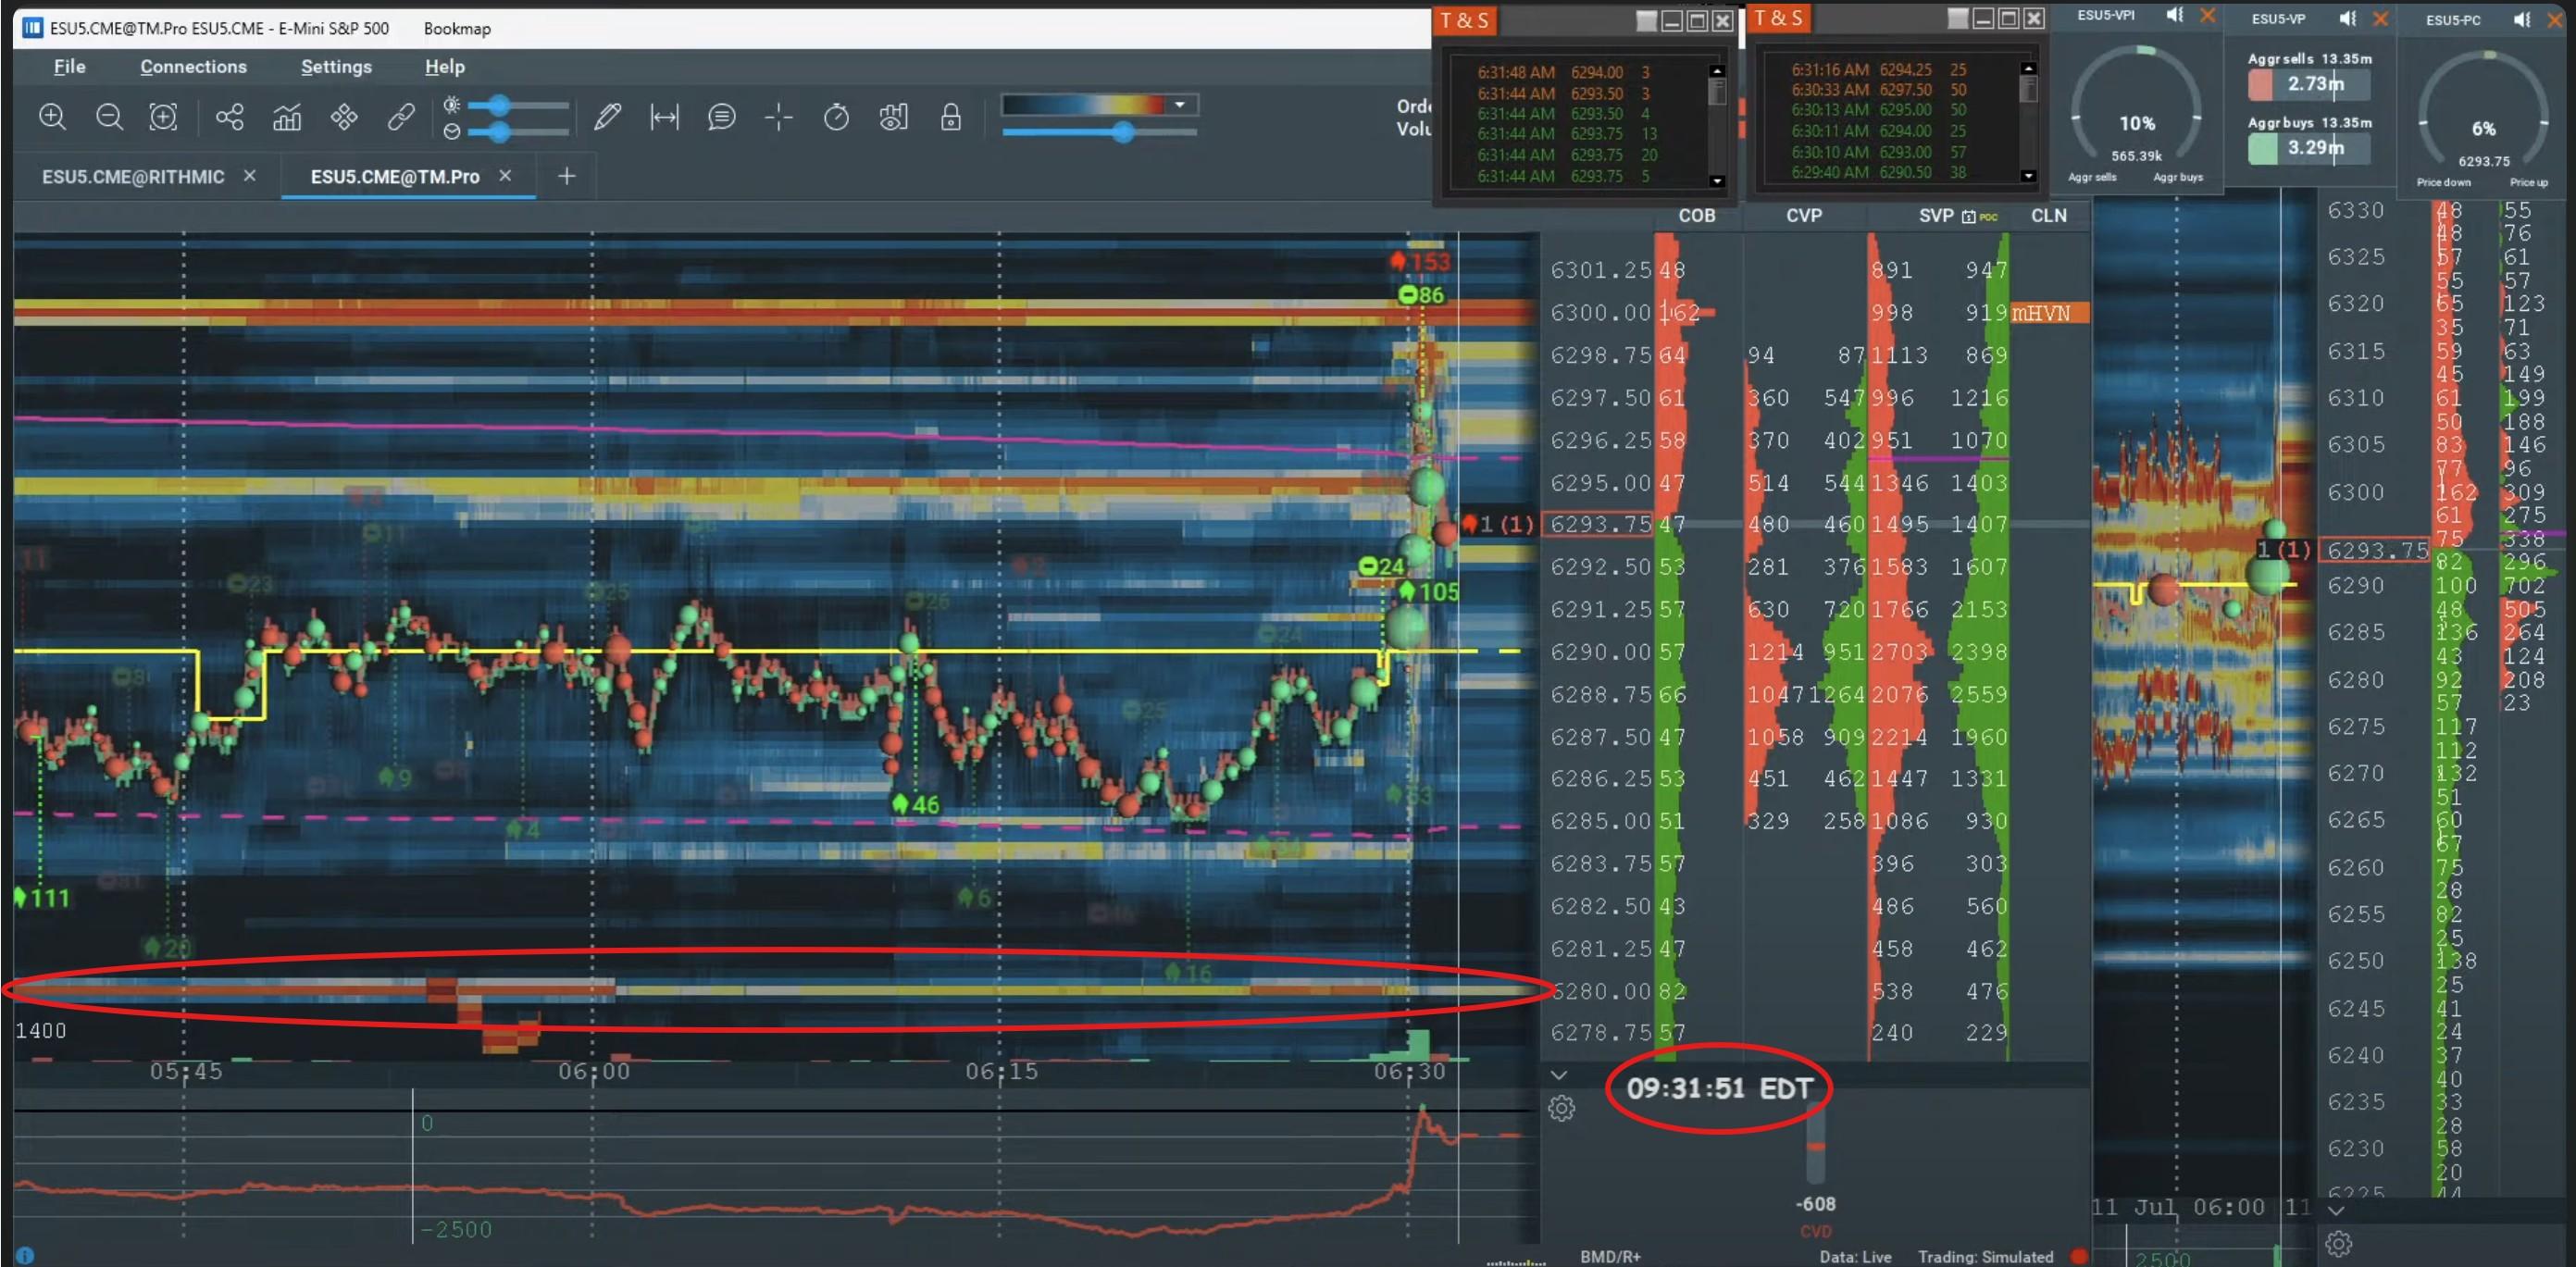
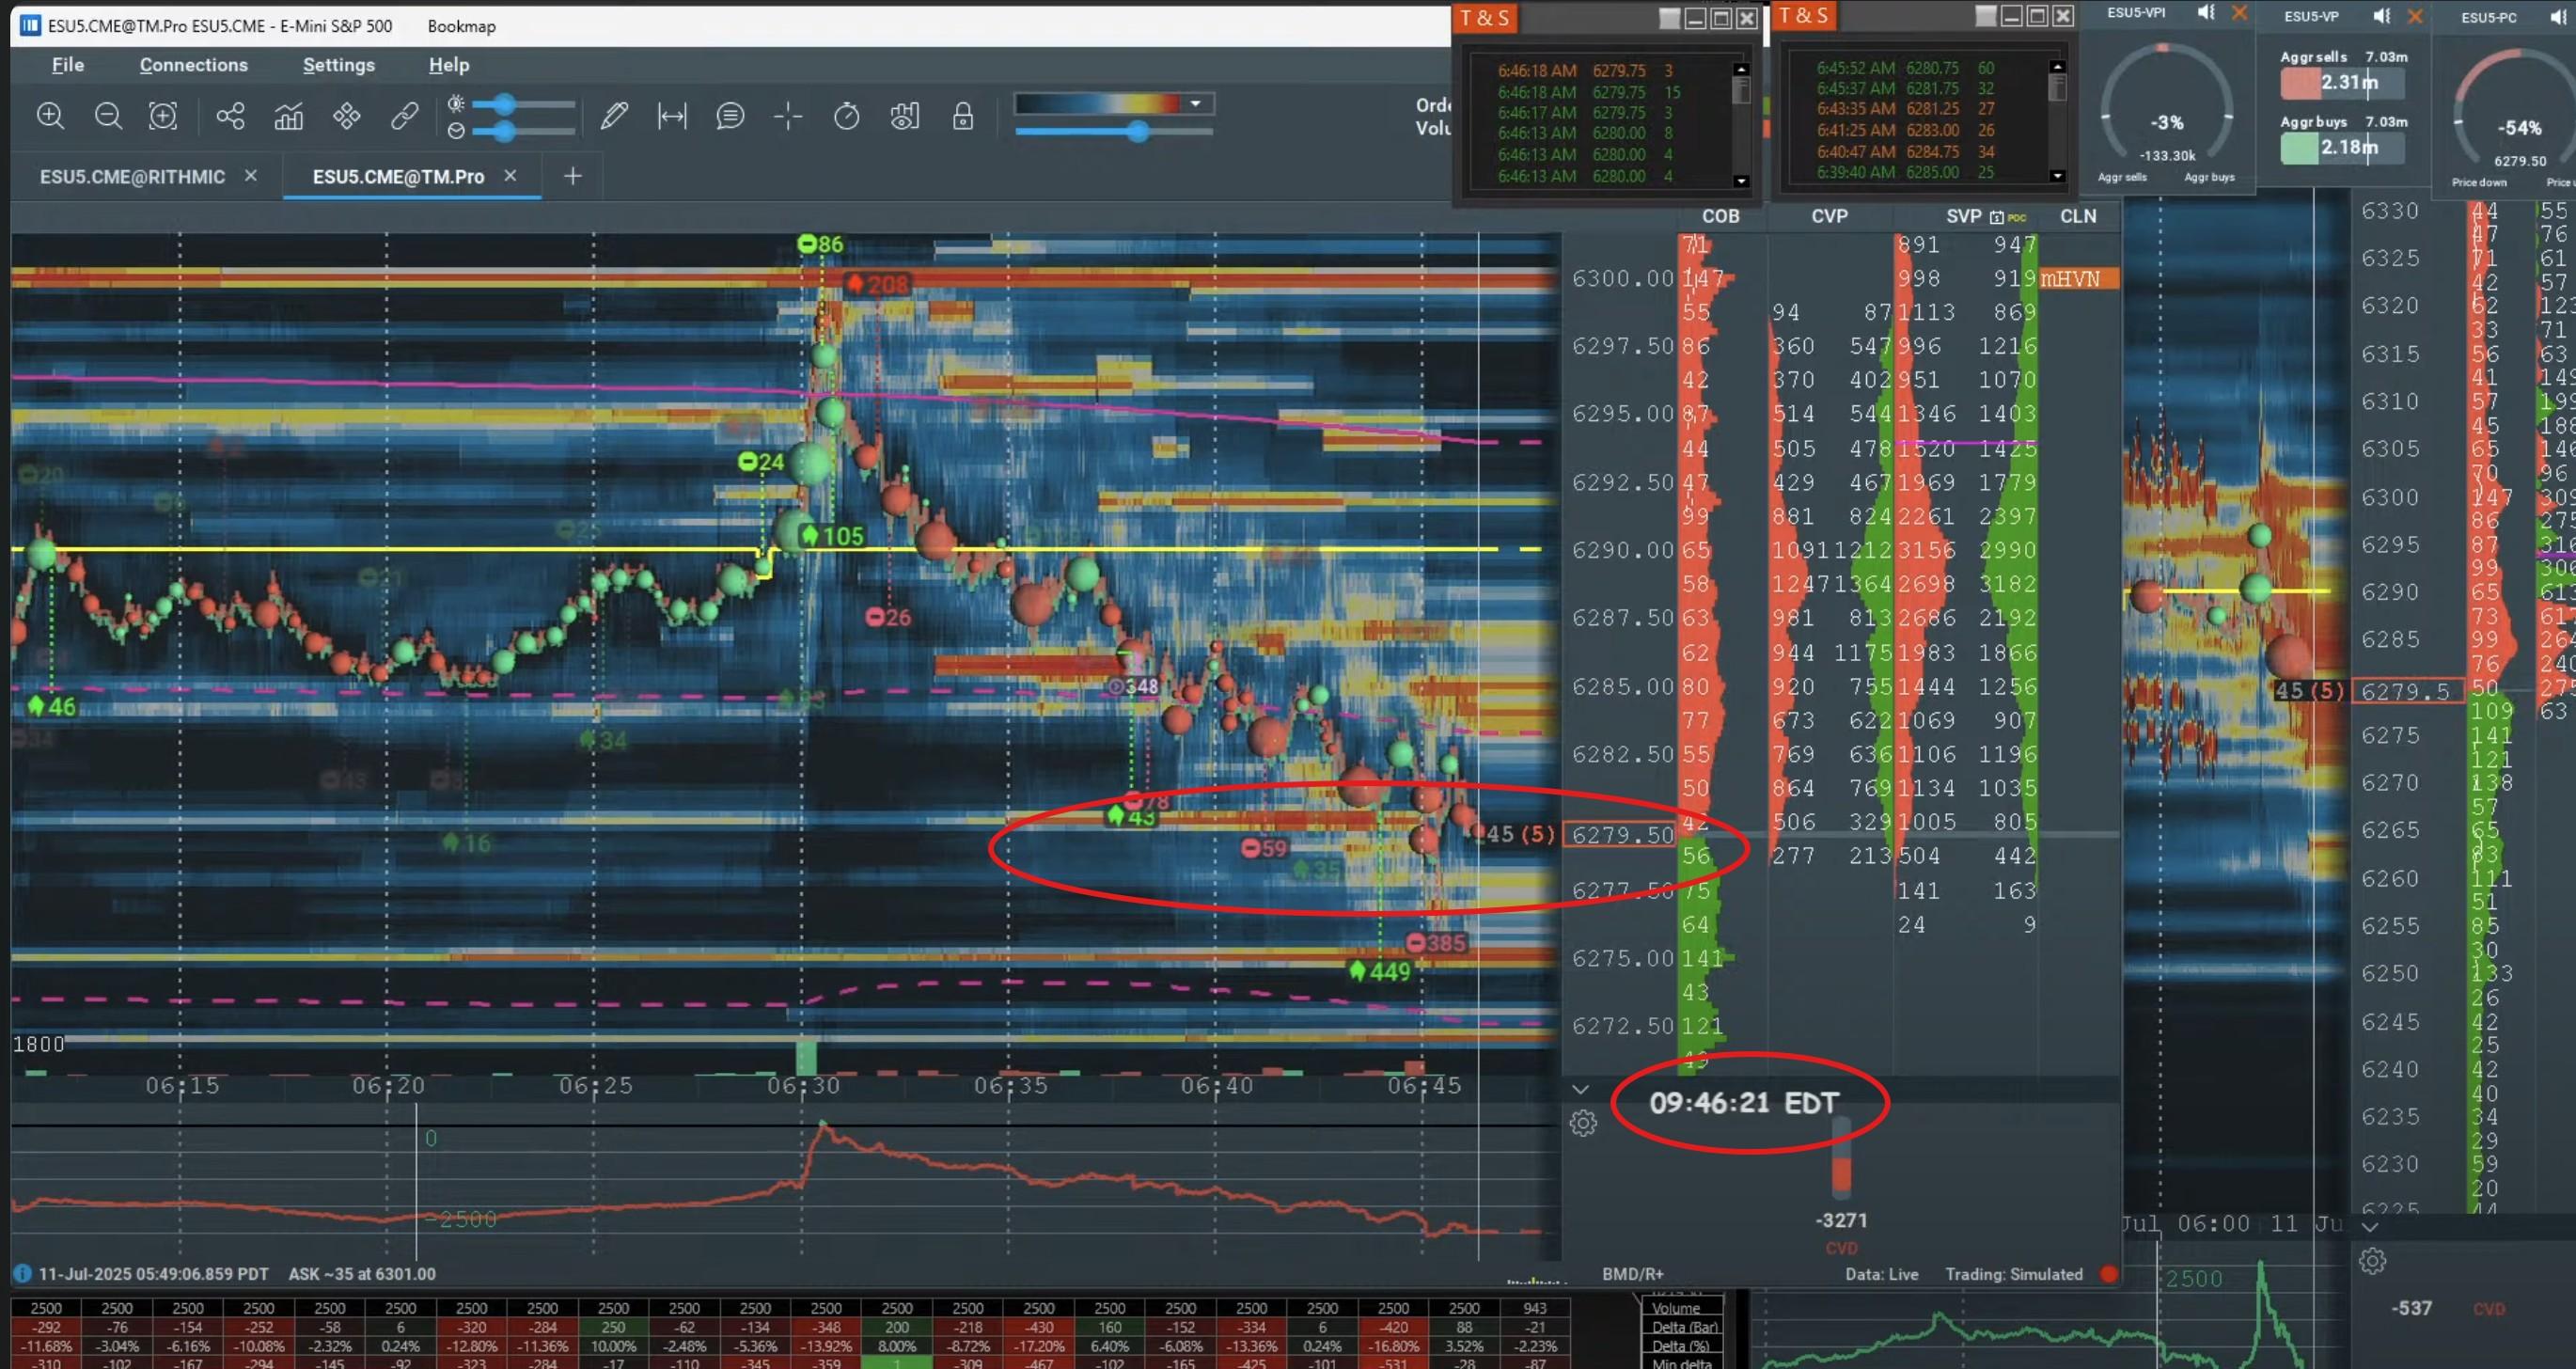
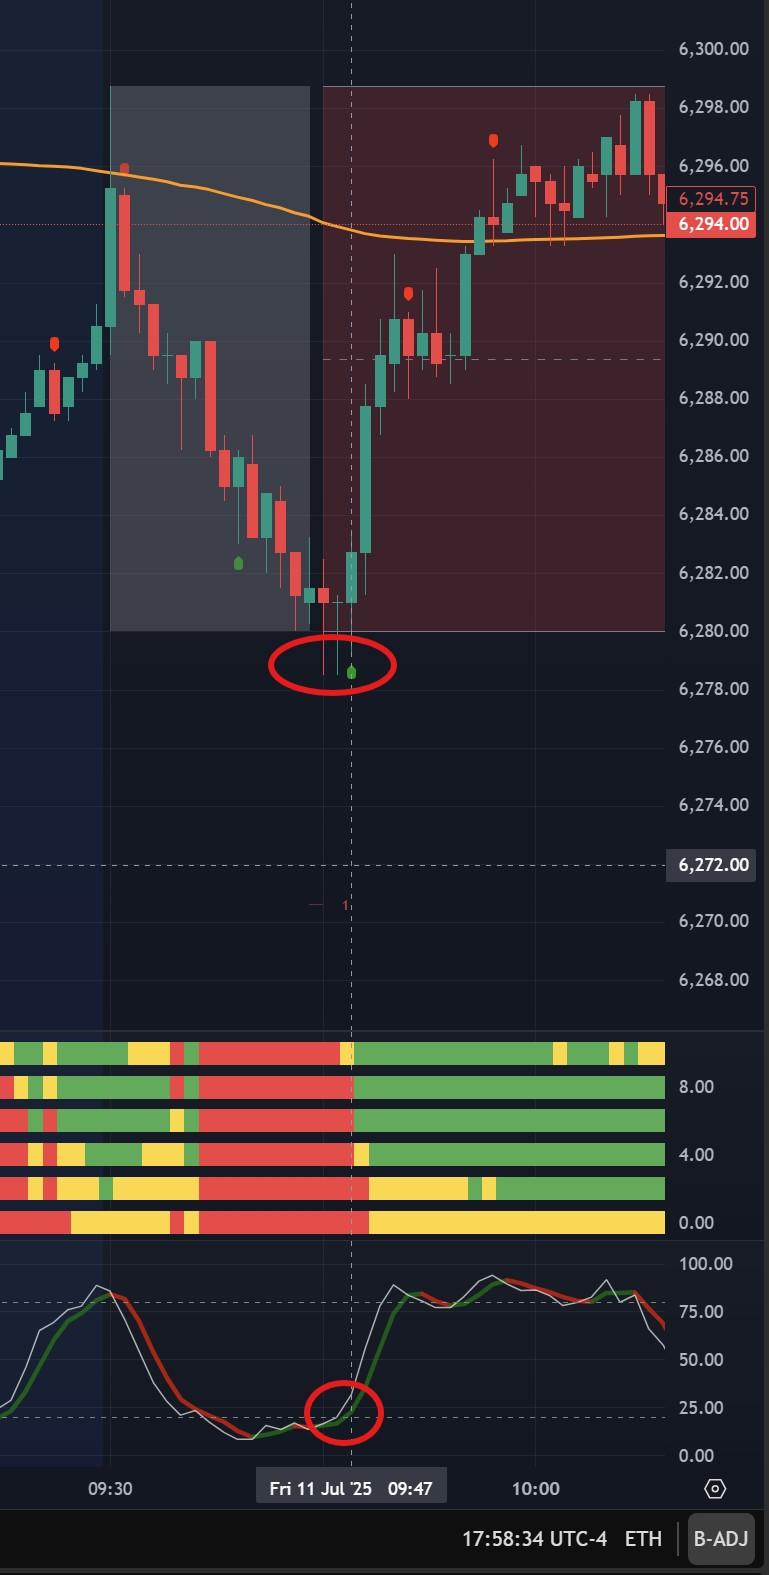
Easy. In picture 1...Market just opened. There is liquidity that has been sitting down there at 6280. see how price goes down there to grab the liquidity (picture 2). Now picture 3 show a reversal dot at 6280 area (circled in red). Look what happened after the reversal dot.

- Today
-
 Som1 please reupload ramp version 8 patched, many thanks
 -
Welcome to Indo-Investasi.com. Please feel free to browse around and get to know the others. If you have any questions please don't hesitate to ask.
-

Need a copy of Future Analytica L2Azimuth
shorttrader replied to roddizon1978's topic in Ninja Trader 8
Well i don’t like SL biger than 10 ticks on ES. Show me examples how you do, its easy to say u know but in realtime bookmap with small SL not really exactly… thanks -
I am also happy to join this GB. I have being learning/trading since 2020 with no success, going no where.
-
yes more participants less the cost all those levels of data 2 and he claims a 3 wich i have never heard of will mess you up a bit is like trading with bookmap decieving and confussing thos pulling and stacking patterns vanish in in a blink of an eye is like imbalances in the footprint but for learning is ok till you get convinced it dont work ...; )
-
I dont personally use anything fancy really in my daily trading activity and I dont currently have level 2 or level 3 or level 4 for that matter and so it isnt really something that I would beat myself up over night for not having it. Regardless, I do not mind chipping in at all for the cause.
-
I think it is somewhat difficult to justify "cheap". But one thing I do know is, the more people get involved, the lesser and smaller the amount would be for each individual.
-
please anyone reupload the working ramp 8. many thanks
-
shawnallen21 joined the community
-
can anyone please share this course https://fttuts.com/the-forex-scalpers-supply-and-demand-masterclass-package/
-
Good afternoon, does anyone have the OGT NT8 indicators they could share? More specifically, OGT Key Levels / OGT Dom Pro. Thank you.
-
hello anyone have david weiss more materials ? i already have his catching trend reversals dvd . thank you in advance
-
Thank You, Kadi! I'll do it. Appreciate your reply!!!
-
 eddygarod reacted to a post in a topic:
Edge Runner Auto (from Pro Edge Trading)
eddygarod reacted to a post in a topic:
Edge Runner Auto (from Pro Edge Trading)
-
Save the default strategy settings and then the folder will show up
-
 FXRebateHub changed their profile photo
 -
Use any reversal indicator with bookmap which provide L2 Data. Wait for the market to reach the liquidity zone(s) on bookmap (wallstreet cannot hide their orders). Once your indicator prints a reversal off the liquidity zone, take your trade. Again, as with anything in trading, its a probability.
-
Hi guys, for some reason after I successfully install this strategy, the folder didn't show up in Documents-NT-templates-strategy folder. The strategy folder is just empty. Anyone else has the same issue. I can however apply it to the chart. Reason I'm looking for it is b/c I want to add the ATM templates into this folder, but without it I can't do it. Please help. Thank you in advance!
-
build it with ai modify an existing indicator
-
⭐ goldeneagle1 reacted to a post in a topic:
Arc-ai
-
⭐ goldeneagle1 reacted to a post in a topic:
Arc-Ai Striker Trading System (req)
-
⭐ goldeneagle1 reacted to a post in a topic:
PJS Profile Bars & PJS Heiken Ashi Need Unlocking
-
⭐ goldeneagle1 reacted to a post in a topic:
tradingorderflow.com
-
⭐ goldeneagle1 reacted to a post in a topic:
tradingorderflow.com
-
⭐ goldeneagle1 reacted to a post in a topic:
ETP Ray Trend
-
 mikobit joined the community
 -
Need a copy of Future Analytica L2Azimuth
shorttrader replied to roddizon1978's topic in Ninja Trader 8
look the problem is at the rejection can happen in different ways. You cannot use minute chart it will work only in range or tick chart but we need confirmation, the confirmation should come from spoofing or layering. But there is a second way but i need a very good programmer for that. -
Need a copy of Future Analytica L2Azimuth
shorttrader replied to roddizon1978's topic in Ninja Trader 8
Trusting without malware that was my question. -
One called quick tester. This one doesnt have it. I believe the file needs to be called ARC_FullSuite or something like that.
-
he just modified free nt8 indicators los of level 2 jt stats ,edslevel2 ,speedtick (speedof tape) worthles in daytrading yes if brokey can provide them cheap is ok all those indicators are already chewed years ago
-
Theres nothing to do with l2 you will waste your time is a obfuscated software cant modify sh**it a reversal indicator that continuously is right maybee atr or use emas/ vwap is more reliable and are free the problem is trying to go granular in trading being small tick charts etc and trying to beat algos is not gonna happen first of all our platforms and data lag too much procesing power pc ,latency etc go with minute charts is a good start dont fool yourself trying to convince yourself for God sake is a waste of time i have been there i have done that many years ago ...
-
misalto reacted to a post in a topic:
Need a copy of Future Analytica L2Azimuth
-
I dont know if traders ave realized automation is worthlessthis past and actual year, if you trade nq or mnq that has more noise and more volatile than nq yes this guys at arc convince people to buy their garbage i dont fall for that anymore prop firms with intraday DD ouch i prefer to stay away for now ... I would like to hear about a trader that uses anyking of automation i never heard and know of a trader till this day the only one that had youtube upside down is L2 wich prints money on nq133 tick chart and es 8 range chart oh my God im susrprised and curious to see i will pay 5k or above
-
misalto reacted to a post in a topic:
Arc-Ai Striker Trading System (req)
- Yesterday
-
If anyone here, anyone at all, successfully trade using their bots and algos, please raise your hands.😜 Even better, if anyone here, anyone at all, successfully passed their prop firm evaluation accounts, using ARC's bots and algos, please speak.🤪